Good evening StockBandits!
The upside pace slowed last week, but the major averages were still each able to post gains. Along the way, the RUT and DJIA each completed win streaks of 10 straight sessions while the S&P got to within 1% of its all-time high. Clearly, stocks are still in style for now.
Despite the distance this rally has carried since the last meaningful pullback (mid-November) and the opinions of plenty that the top is near, nothing has surfaced yet technically to indicate a change of character. Many are calling for a major turning point, but price is the gauge and so far money keeps flowing into this market. Furthermore, whenever a turn does come, it’ll likely be much more of a process rather than an event.
I say that because throughout this rally we’ve seen bulls repeatedly rewarded for buying even minor dips. That has prevented any real pullbacks lasting longer than a few days, while simultaneously conditioning traders to keep doing the same thing. So once greater supply hits this market, the bulls will likely need to have their hands slapped more than once before they ultimately give up the trend which has been so good to them. By the same token, the bears have zero confidence and that will also take some time to build up. When nobody wants to sell, it keeps things afloat.
That’s an important concept for cautious bulls and bears alike to keep in mind. The process-vs.-event scenario could alleviate some fears of those who worry about buying at or near the top, and can help bears remain cautious (protecting capital) until more favorable conditions emerge at some point in the future.
Right now, I’m sitting in mixed positions with both longs and shorts. There are opportunities on both sides, despite the fact the trend remains up. However, I’m doing my best to stay positioned net long until the market stalls out.
Let’s get to the charts.
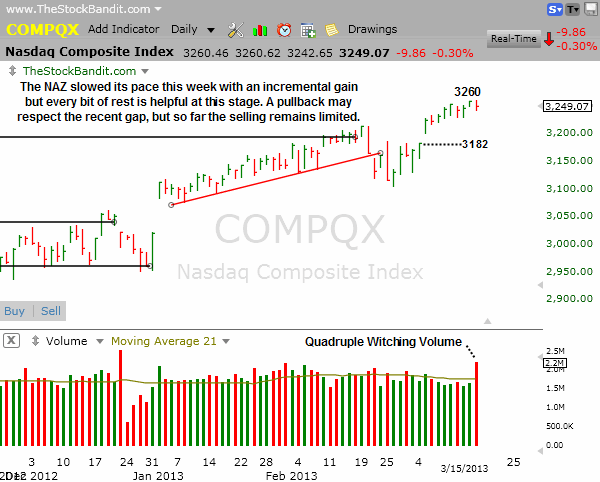
NAZ – The NAZ, like the others, saw massive volume on Friday which was tied to quadruple witching. That’s just a fancy way of saying that multiple derivatives products expired on Friday (index futures, index options, single-stock futures, stock options) and when that happens it has an effect on the trading volume of equities. For the day, this index finished red but that can’t be viewed in the light of extreme volume since this happens quarterly and no change of character took place in price. This index posted a gain for the week and is just hovering near its highs here while maintaining the breakaway gap from two weeks ago. Any turn lower is likely to see that zone get defended.
SP500 – The S&P once again moved closer to its all-time high of 1576 last week with a quiet gain, finishing just 1% shy of that mark. This index has carried a long way just since the February pullback (1485), and a rest would be very beneficial for bulls. However, they have momentum on their side and have been reluctant to raise cash.

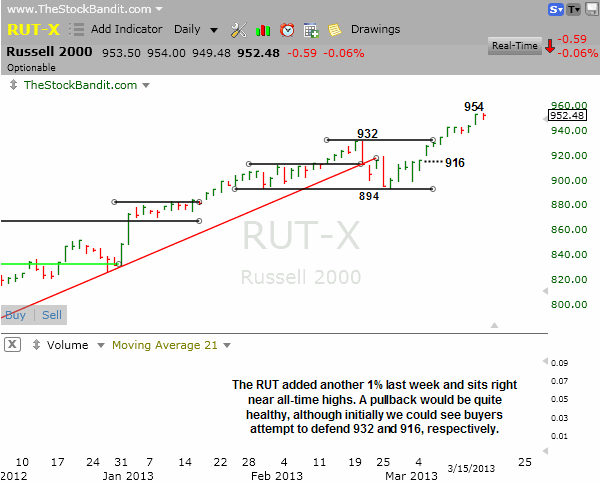
RUT – The RUT keeps marking new highs and last week was no exception as this small-cap index added a bit more distance between current prices and prior resistance at 932. This index is up big over the past 3 weeks, and a rest would help this uptrend to persist, but all we’ve seen of late are the occasional 2-3 day pauses rather than any real profit-taking. It will happen, the key is just to stay vigilant and not become overly anticipatory. Rather, becoming more cautious as prices become extended is the best practice.
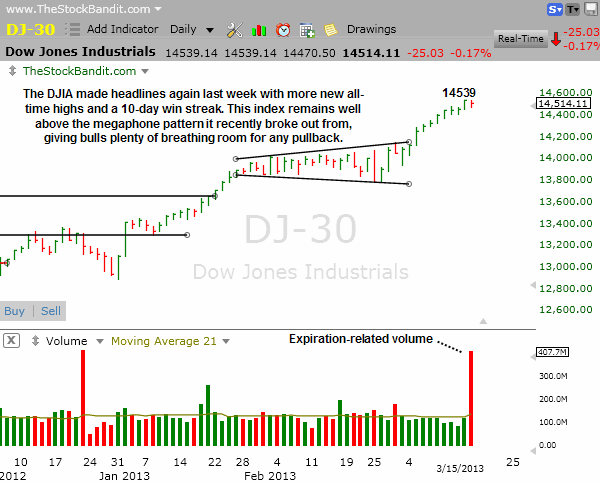
DJIA – The DJIA continues to keep Main Street interested by hitting new all-time highs almost by the day lately. Last week this index capped off a 10-day streak, and that’s the kind of persistent strength that creates excitement. However, this index is getting stretched after this 3-week run so some rest or profit-taking would actually be healthy at this stage.
Notable Names:
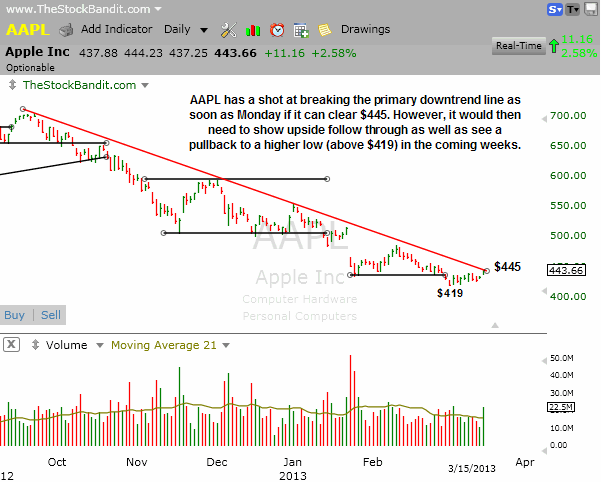
AAPL finished Friday right beneath its primary downtrend line which goes back to the 9/21 high of 705. Virtually any turn higher on Monday would clear that trend line, which doesn’t shift the trend (don’t get excited yet), but it sets a potential shift in motion. The first order of business for this stock will then be upside follow through, followed by a pullback to create a higher low on the daily chart in the coming weeks. That would require 419 to hold, and would pave the way for a recovery effort to begin in this fallen tech giant. Either way, there’s a chance for something positive to occur in this stock for the first time in quite a while after this deep correction.
 Why I Use TC2000
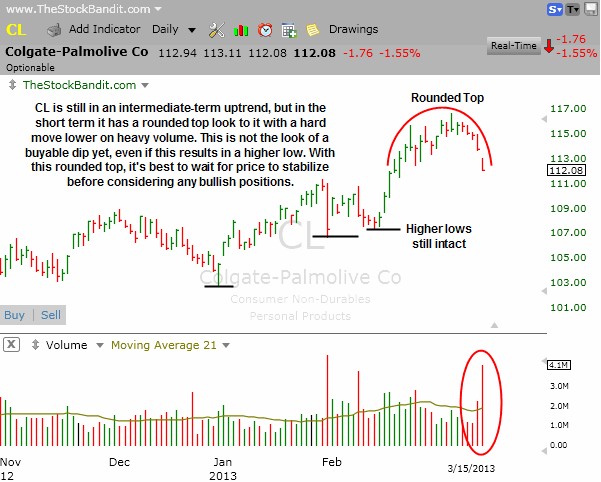
CL is an interesting chart here which offers a great example on how paying close attention to the price action can give some advance notice to stay away. Technically, this stock remains in an intermediate-term uptrend, but over the past few weeks it has developed a rounded top and now is showing intensifying weakness. The trend hasn’t shifted yet, but this rolled-over look is not the type of dip to commit capital to, generally speaking.
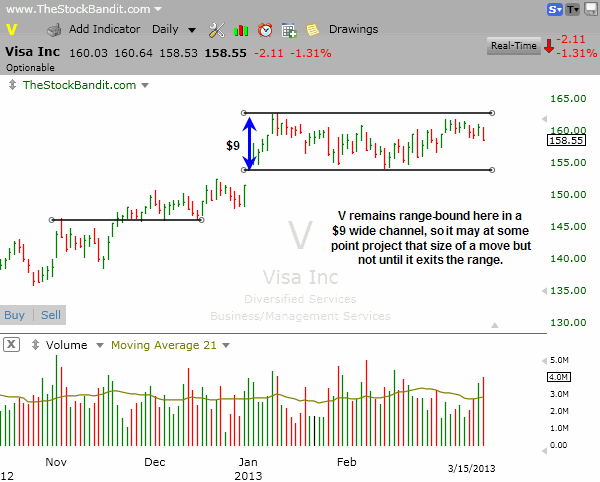
V is still moving laterally here just beneath its highs and the stock has carved out a very clean trading range. The height of this channel is about $9, which projects a $9 move out of this base once an exit from the range is seen. So far, price isn’t acting ready to clear resistance, so it’s one to keep on the watch list. An entry here may simply result in dead money should this phase of indecision persist, so it’s best to wait.
New Swing Trade Candidates:
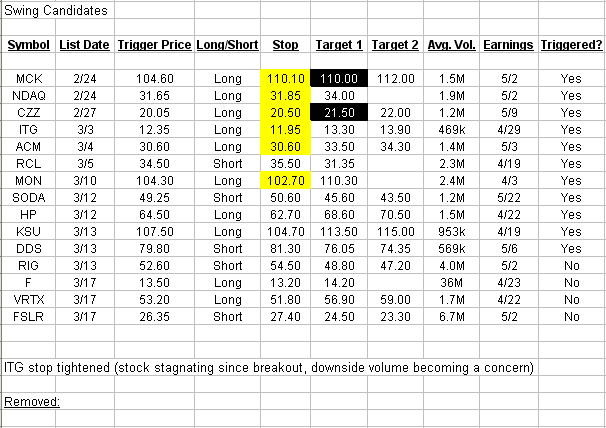
These stocks look ready for imminent multi-day moves. Pattern confirmation occurs with a move through the entry level. Initial stop and target levels are also provided.
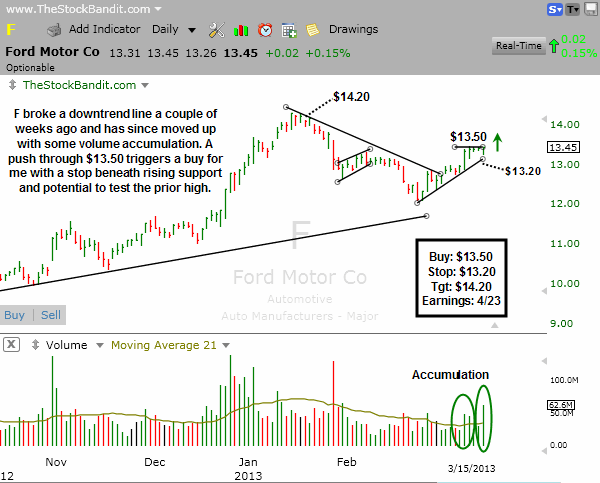
F just recently pulled back but held its longer-term uptrend line and price turned up to clear the descending trend line. Since then it has held higher and rested, carving out a short-term resistance level at $13.50 which I’ll be using as a pivot for a buy. Rising support will serve as my stop, and I’ll be looking for a test of the high as my target. Earnings are about 5 weeks away so there’s ample time for this one to make a move.
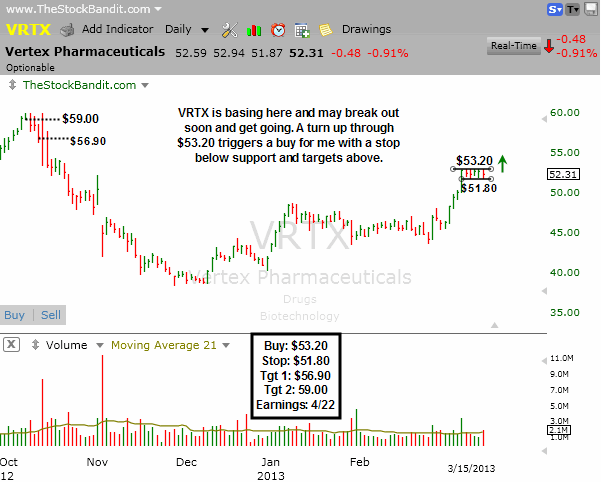
VRTX has rallied and rested in recent weeks, setting up a very clean bull flag pattern here. A turn up through $53.20 triggers a buy for me with a stop beneath this little channel and a target just shy of resistance from last fall. This one also has earnings about 5 weeks out, so there’s time for a decent move here before scheduled news comes along.
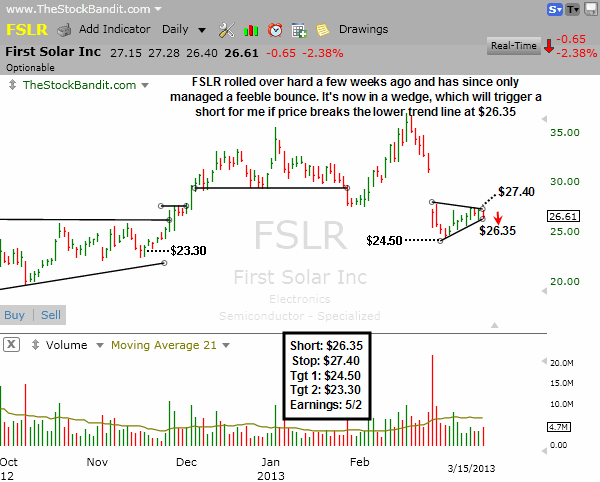
FSLR sold off hard for 9 days off the February high, and the bounce since then has been unimpressive. Price has instead held below the breakaway gap and is now wedging. A turn lower out of the wedge would occur with a break of rising support at $26.35. I’m looking to short it if that happens, using short-term resistance as a protective buy stop at $27.40 and looking for tests of downside support zones for targets.
Bullish Watch (click for charts)
Bearish Watch (click for charts)
Trade Like A Bandit!
Jeff