


Good evening StockBandits!
The indexes gapped lower as expected to begin today’s session on weekend Cyprus bailout news. Europe never went away, but concerns were renewed over the weekend and media outlets did their job to sensationalize the importance of it. That created sell order imbalances, hence the opening gap.
The lows of the session weren’t far behind, and in fact overnight the futures had already long since turned higher just after 1am ET. Nonetheless, stocks carved out their session lows on the first 5-minute bar of the day, spending the bulk of the day grinding higher in a recovery effort. This looked like a gift both to underinvested bulls and bears alike, as each had been rooting for lower prices and temporarily go them. The buying which followed took the DJIA and NAZ each to positive territory, although they weren’t able to stay there and ultimately finished the day slightly in the red.
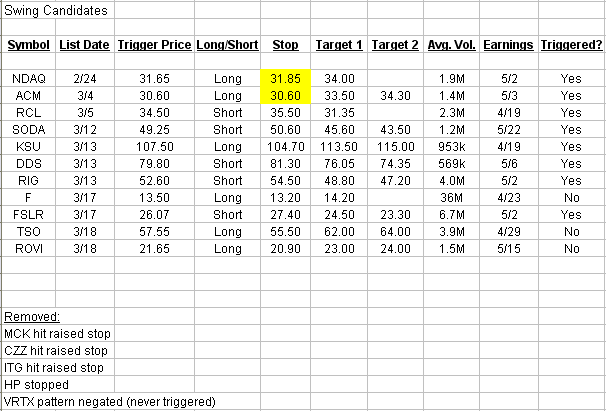
Although the market finished the day little-changed from last Friday, today’s move did shake up quite a few charts. That resulted in some turnover for my swing trades and the removal of others after today’s bars on the charts, so be sure to review the changes on the spreadsheet below if you’re following along at home. Generally speaking, the wide-ranging bars we saw today gave many stocks the chance to establish some short-term support or test the resolve of buyers, and in the end many of them passed those tests. There are still more sloppy charts this evening, however, so my intention is to remain selective with new plays and stick with those which have well-defined entries and exits associated with them.
Let’s get to the charts.
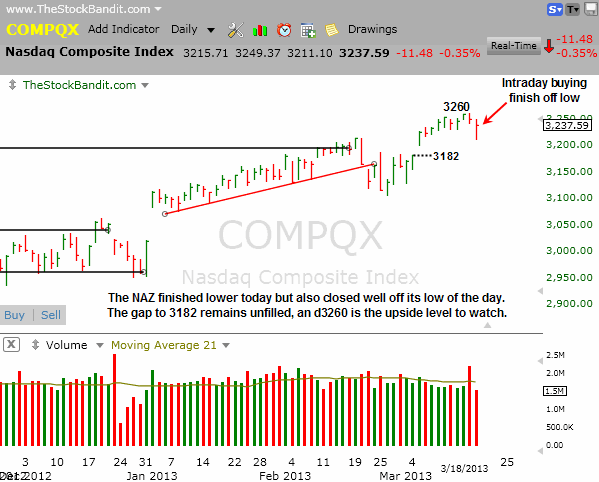
NAZ – The NAZ opened at 3215 today and closed at 3237, showing some intraday buying. The daily bar also depicts a finish off the session low, which points to intraday buying despite a decline since Friday’s close. This index is trying to move laterally here as it maintains the gap from two weeks ago from 3182.
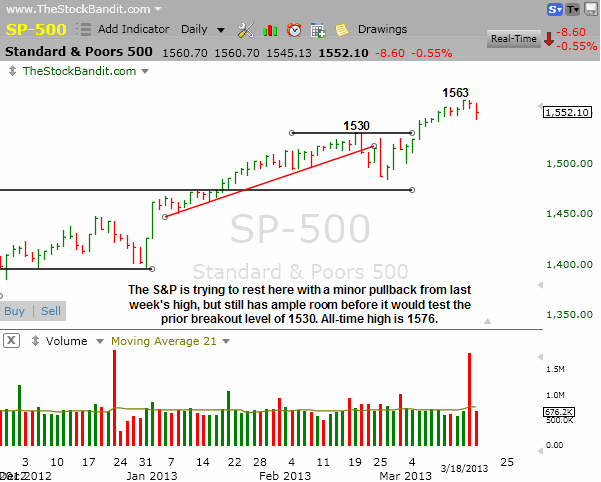
SP500 – The S&P finished in the center of its range today and is just churning here beneath last week’s high. Additional rest here before an attack on the all-time high of 1576 may be a good scenario for the bulls to avoid a breakout under stretched conditions.
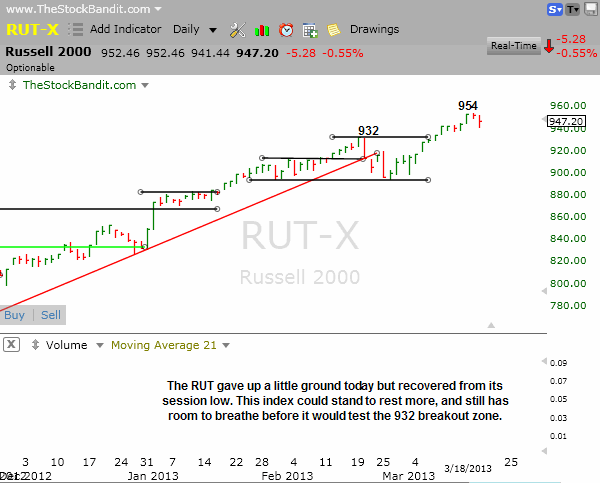
RUT – The RUT is trying to pause here but more rest would benefit the bulls after the recent run off 894 support three weeks ago.
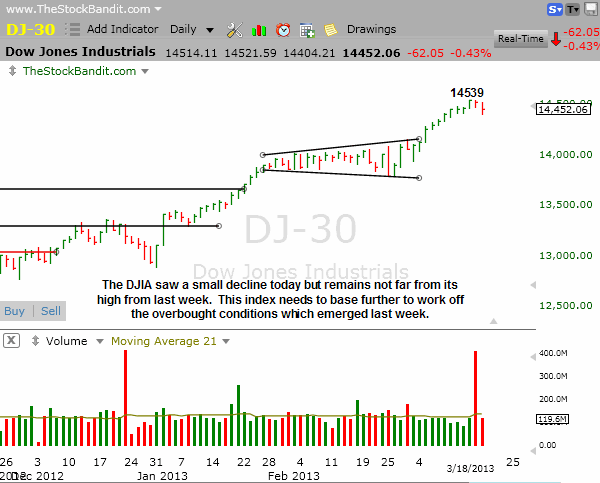
DJIA – The DJIA pulled back slightly today but bounced from its session low. This index may be trying to base here, so this is a decent start but today’s dip being bought was another example of plenty of traders still feeling underinvested.
Notable Names:
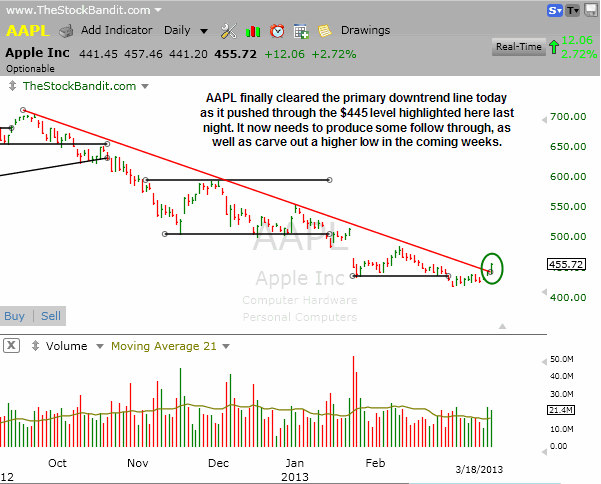
AAPL saw its first positive development today since September as it cleared the downtrend line at $445 highlighted here last night. It finished strong as well, and now could see some follow through. Next order of business if that takes place will be the formation of a higher low on this daily chart.
 Why I Use TC2000
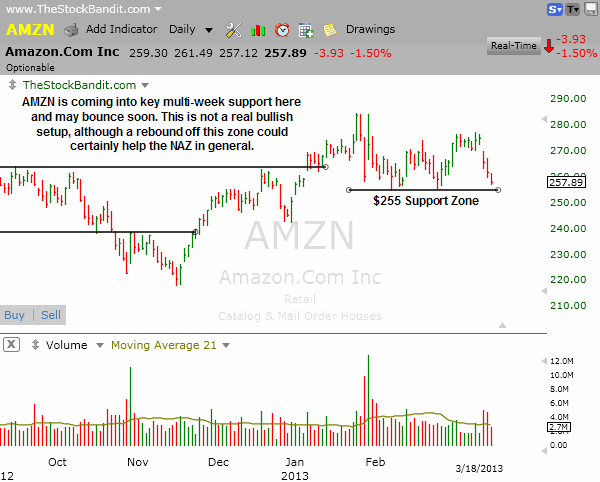
AMZN is coming into support after a multi-day pullback and a bounce in this stock could certainly help the NAZ, particularly if AAPL continues to strengthen. This is not in itself a bullish setup, as the stock is range-bound, but this level may provide a brief lift in prices if it gets defended.
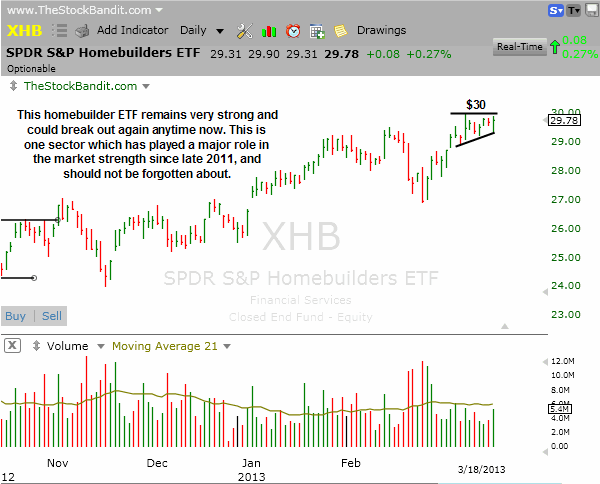
XHB is pressuring the recent high and could break out again. This sector continues to show strength despite having made a huge run since October 2011.
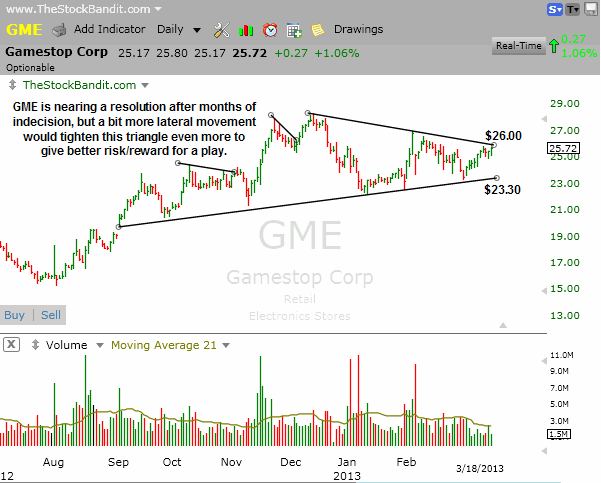
GME is bumping up against resistance of this multi-month triangle pattern and it may break out soon. However, more time spent inside this narrowing range would help create a better setup with a tighter stop as compared to an upside breakout.
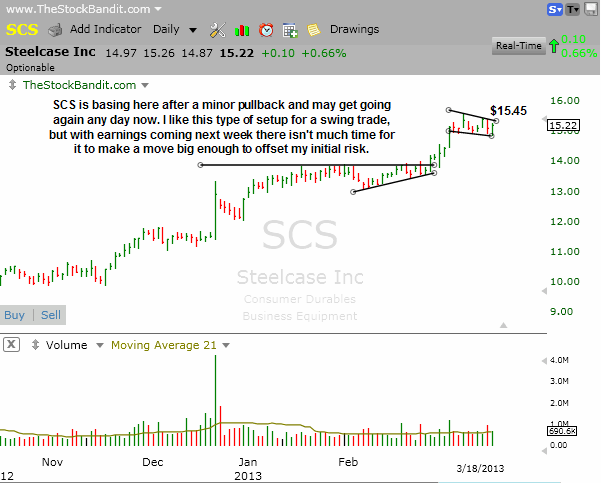
SCS is sitting in a bullish consolidation pattern here after recently making highs, and this setup has a good look to it. I’m not taking it for a swing though, as it’s scheduled to report earnings next week. That gives this one little time to make a move big enough to offset the initial risk I’d be taking between now and then, so the potential reward in that scenario is somewhat limited.
New Swing Trade Candidates:
These stocks look ready for imminent multi-day moves. Pattern confirmation occurs with a move through the entry level. Initial stop and target levels are also provided.
TSO is in a well-defined uptrend and may get going again here shortly. I’m looking to get long if this one clears resistance at $57.75 to begin a new leg up. I’ll use rising support as my stop, and will be looking for a push toward the low $60’s out of this base.

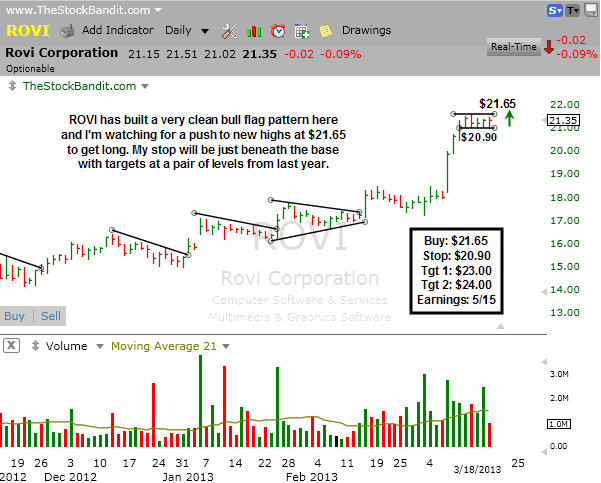
ROVI has built a very tight bull flag pattern and I’m watching for a breakout to trigger a buy through $21.65. This narrow consolidation comes with well-defined short-term support which I’ll set a stop just beneath, and I’ll be looking for it to potentially test a couple of levels going back to early summer 2012.
Bullish Watch (click for charts)
Bearish Watch (click for charts)
Trade Like A Bandit!
Jeff


