


Good evening StockBandits!
The market continues to coast higher with no brakes as it reaches uncharted territory almost daily. The widely-discussed Tuesday effect held true yet again this week with each of the averages climbing but perhaps most importantly the S&P as it left a very small multi-day base. Often times we see high expectations fail to produce with everyone looking the same direction, but despite broad expectations for strength, another Tuesday lift took place. That led to some follow through in today’s session as well, taking the market even farther from its April lows of just 4 short weeks ago.
During the current bounce, the S&P has rallied 8% off its April 18th low, while both the NAZ and RUT have added more than 10%. With those gains occurring in just 19 sessions, it has left the daily charts looking very strong yet extended. We’ve only had a few down days throughout this stretch, keeping shorts on the run and underinvested bulls frustrated with the lack of pullbacks. As a trader, it’s so critical to think in terms of risk/reward at all times. Right here, right now, the potential for short-term reward on the upside in most cases seems pretty limited. New entries in many cases would involve chasing extended moves, making this a higher-risk spot for new buys even though no weakness has surfaced yet.
Markets do move both ways. Sometimes they make extensive moves in one direction before stalling out or reversing, but eventually it happens. Finding new longs at current levels isn’t easy, simply because so few stocks have been able to put in the basing action required to digest these big runs. It’s not a matter of fearing that the market suddenly comes crashing down right off its highs, as that’s just not likely. Crashes rarely occur from the top. However, from a risk/reward standpoint it’s more a matter of understanding that we’re getting into some thin air here (which could prevent a lot of additional upside). Additionally, without some basing action to produce short-term support levels it’s just that much more difficult to determine downside exits should a pullback arrive sooner than later.
Let’s get to the charts, and tonight I’ll be using the major ETF’s just for a little different perspective.
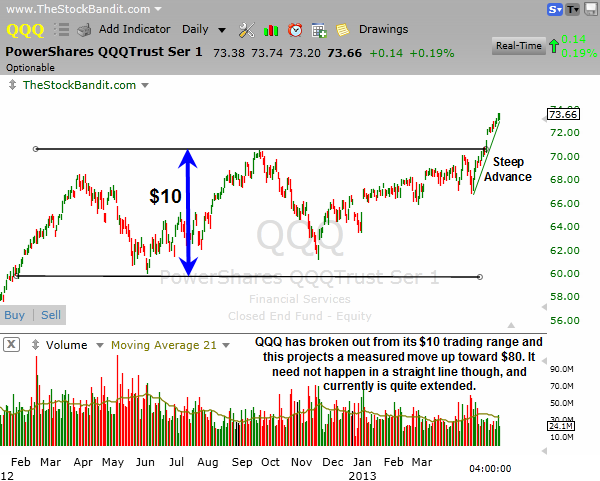
QQQ – The NAZ 100 ETF has held its recent breakout nicely and has ample room between current levels and the breakout zone from $70.60, but remains short-term extended here after a very steep advance. Some healthy profit-taking at this stage would prevent prices from becoming more overbought, and would allow this move to be digested in a constructive way via some backing and filling.
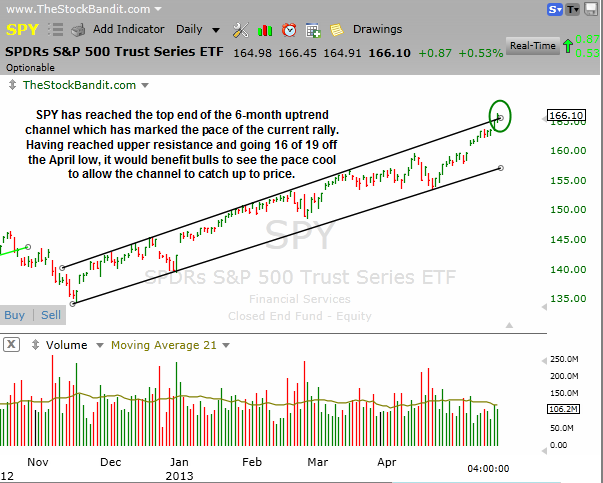
SPY – The S&P 500 ETF finshed just outside its uptrend channel today by closing above $165.50 where the upper trend line stands. This shows SPY to be overbought and therefore more vulnerable here to a potential short-term pullback. At a minimum, some lateral price action would allow the channel to catch up with price and keep the uptrend in good health.
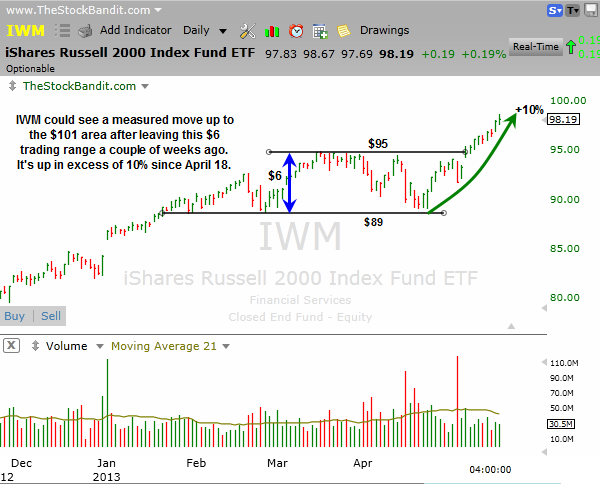
IWM – The Russell 2000 ETF is up substantially over the past 4 weeks, tacking on over 10% during that time. It has advanced 15 of the last 19 sessions, and despite having room to run further with a measured move up to the $101 area, it nonetheless is overbought here and a short-term rest would do it good.
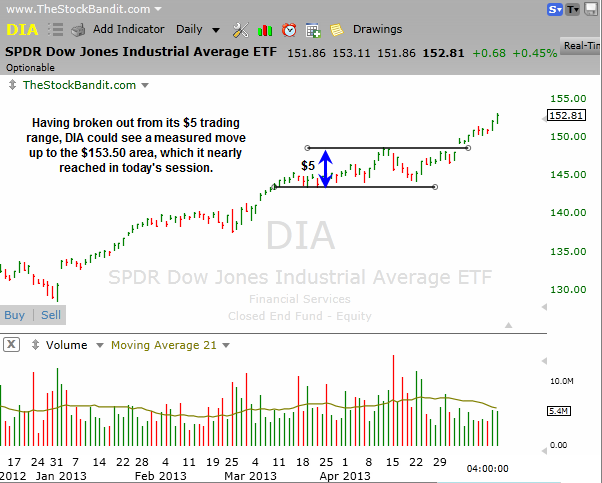
DIA – The Dow Jones Industrial Average ETF has room to rally a bit higher to complete its measured move of roughly $5 since leaving the rectangle pattern a couple of weeks ago. At the same time, it has nearly completed its move and is therefore not in a spot yet to warrant new entries on the long side.
Notable Names:
RHT is like many stocks tonight which have seen big runs, in this case 10 consecutive up days. It’s now at upper resistance and is short-term overbought, which means it needs rest before attempting to break out if it’s going to stick.

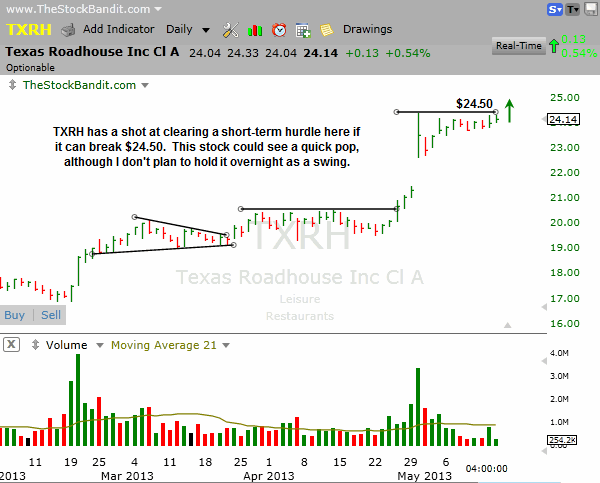
DOW is also back at resistance after a significant short-term rally. This stock also needs rest before attempting to clear resistance, as a breakout after an extended run simply becomes more prone to failure due to natural profit-taking once the current momentum comes to an end.
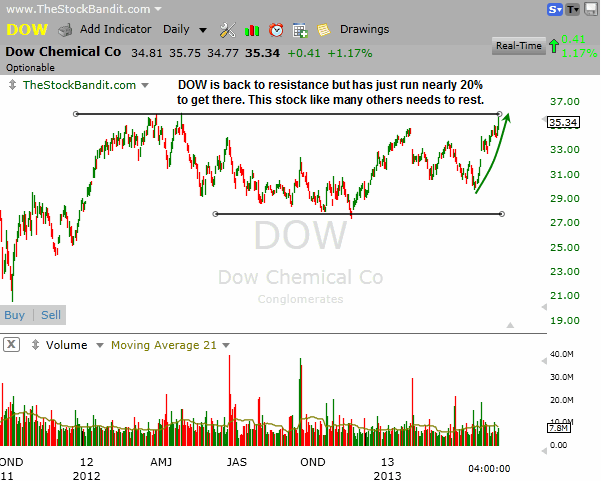
DIS is suddenly almost a momentum stock with this daily chart having nearly gone parabolic. Of particular note is how in the past few weeks, this stock has put in virtually no rest aside from an occasional 2-3 day pause.
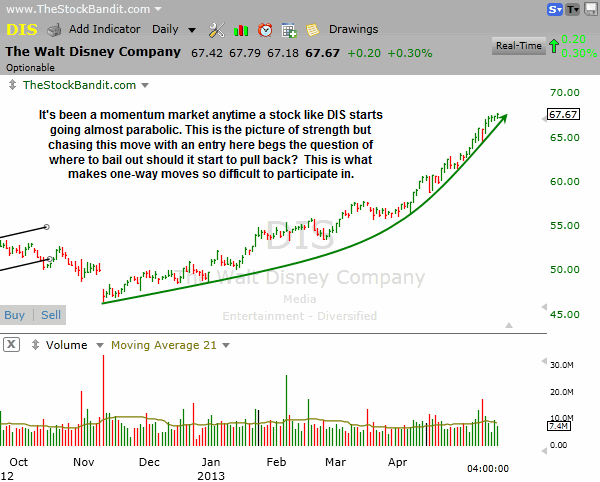
ACN is challenging a small descending trend line here as it tries to perk up after a recent minor dip. This looks good for a quick trade on the long side if it can clear $81.10, but it tends to move somewhat slowly and with the market so stretched I’m just not in love with this chart enough to take it for a swing. Upside reward just seems like it doesn’t outweigh the risk by much.
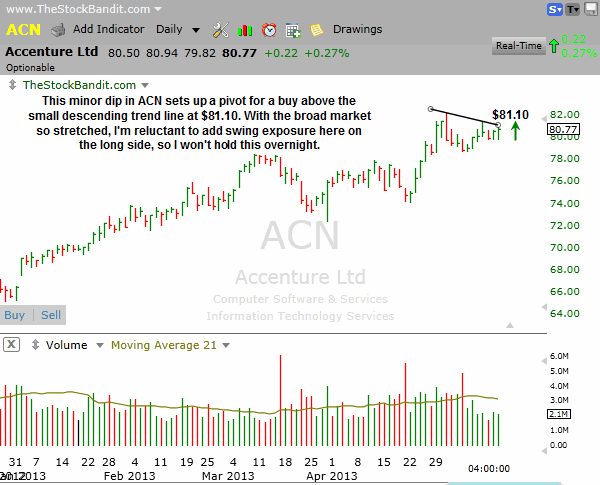
TXRH has actually put in some good rest in recent sessions as price respects the recent highs as resistance. A turn up through $24.50 could generate some short-term interest on the buy side, so I like this for a momentum trade. However, once again the setup just isn’t ideal (weak finishes in the past 3 sessions) and therefore with extended market conditions I won’t be taking it for a swing.
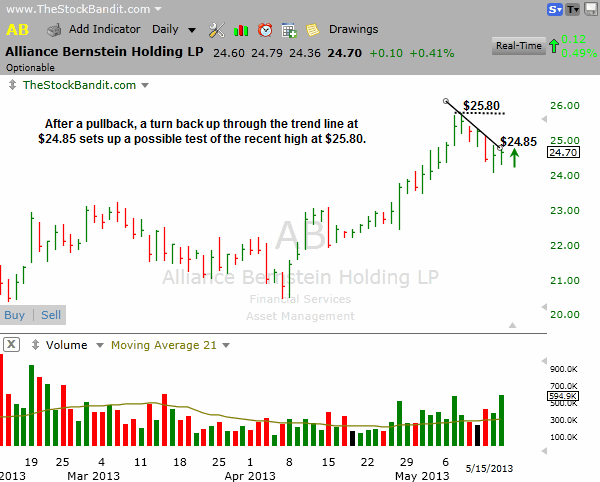
AB is stabilizing here over the last 2 sessions and could turn back up any day. I’m watching the descending trend line at $24.85 for a break to trigger a momentum buy, and this one could quickly test the prior high. For a swing however, a stop would need to go under Tuesday’s low (roughly $0.75 from entry) to make a potential $0.95, which doesn’t warrant a swing.
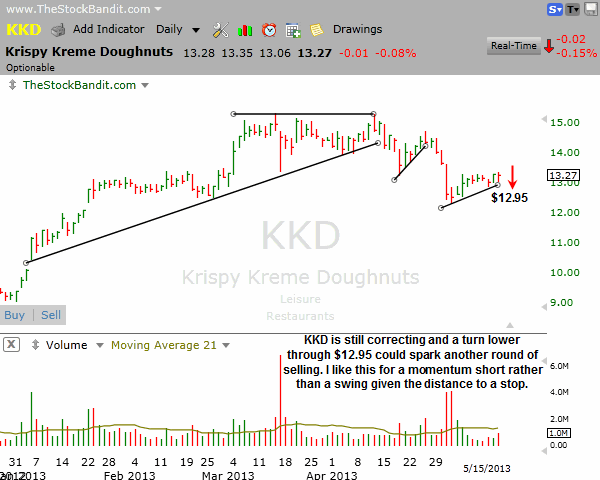
KKD is still struggling to make any meaningful upside progress, and in fact the current bounce looks to have stalled out. A break below $12.95 could spark another round of selling, setting up a nice momentum play here. I’d be looking for a test of the recent low, which would be about a $0.60 move, whereas a swing stop would be roughly $0.45 away, which isn’t a good enough risk/reward for a multi-day play.
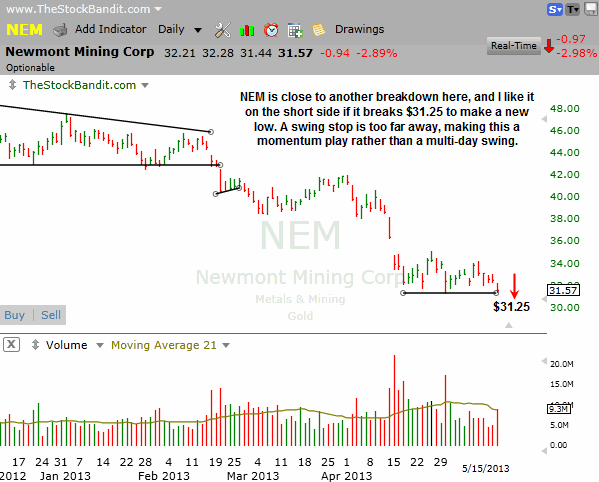
NEM is looking ready to break lower again here and I like it on the short side below $31.25. A swing stop would be several points higher, so this is a momentum setup in my opinion and not a swing.
New Swing Trade Candidates:
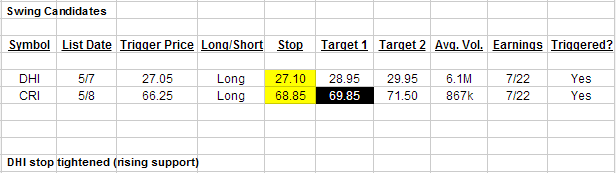
No new swing candidates tonight. Broad market is too extended to add new longs, yet has been too strong to add new shorts. The wait continues for me with limited holdings at the moment while waiting for better opportunities to add exposure. I’m eager to put on more exposure, but the market simply is not cooperating at the moment. I’ve forced trades in the past and paid for it, so being patient here is simply a form of capital preservation while waiting for better swing conditions to arrive.
Bullish Watch (click for charts)
Bearish Watch (click for charts)
Trade Like A Bandit!
Jeff


