


Good evening StockBandits!
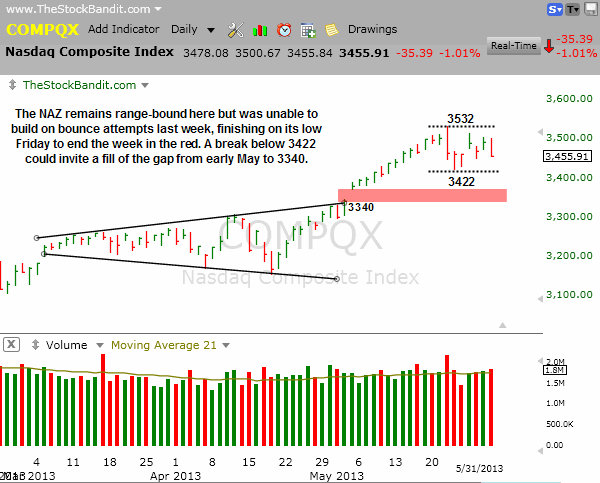
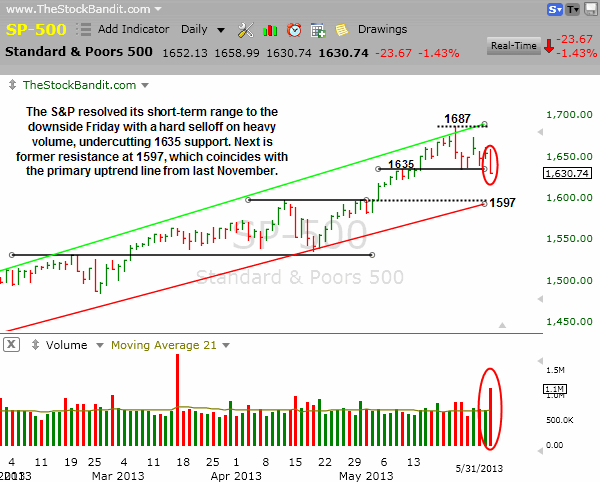
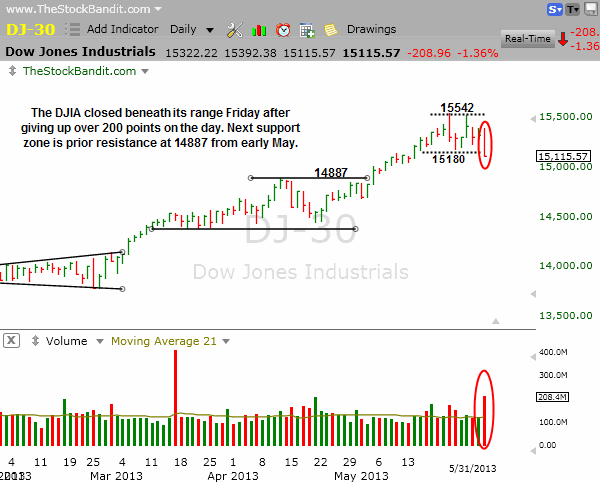
A fast Friday afternoon selloff ahead of the weekend left the market at its session lows by the closing bell, and delivered a downside resolution to the trading ranges we’ve been monitoring on both the S&P 500 and the DJIA. The NAZ saw a new multi-week closing low, although it held inside its intraday trading range along with the RUT. Across the board, however, the big stat was that each of the indexes concluded their 2nd straight week of declines after seeing 4-week streaks of gains.
Interestingly, May began and ended with bookend big selloffs, yet each of the big indexes posted gains of 1.8% to 3.9%. That’s not quite the “sell in May” phenomenon many were expecting, which kept quite a few bears frustrated. In the past couple of weeks though, we saw some exhaustion set in after persistent strength, and that has put some short-term highs to keep tabs on when it comes to the daily charts. The trading range of the past two weeks also has provided some levels of support, although now 2 of the 4 have fallen below those support zones (DJIA and S&P 500).
Going into a brand new month, there’s a lot to consider. We have a while before the next earnings season, keeping traders focused on the economic front, the Fed, and most importantly the price action. The trends are still up for the intermediate term, although in the short term stocks are seeing the first bit of selling pressure in roughly 6 weeks. That may provide some 2-way price action, making it a trader’s market once again. It will also require greater attention to risk management at a time when so many have forgotten over the past 6 1/2 months that the market can in fact move lower.
Let’s get to the charts.
NAZ – The NAZ has 33 points of room on the downside before it would break this trading range to the downside, although on a closing basis Friday constituted the lowest close since May 14. A hard break below this range invites a gap fill from early May. I think it’s notable how on the 2 advances we saw last week, in neither case did this index finish strong. Each occasion saw weak finishes compared to the session highs, and each was followed by weakness the next day. For now it’s holding up, but it may just be a matter of time before we see a move down to fill the gap to 3340.
SP500 – The S&P sold off hard Friday to break 1635, which is a downside resolution to the trading range we’ve been watching. Next support is the primary uptrend line which also stands near former resistance at 1597. That gives this index an open door for more selling in the days ahead, but nothing has been a given lately. Friday’s elevated volume certainly isn’t bullish, especially considering it accompanied a multi-week low in price.
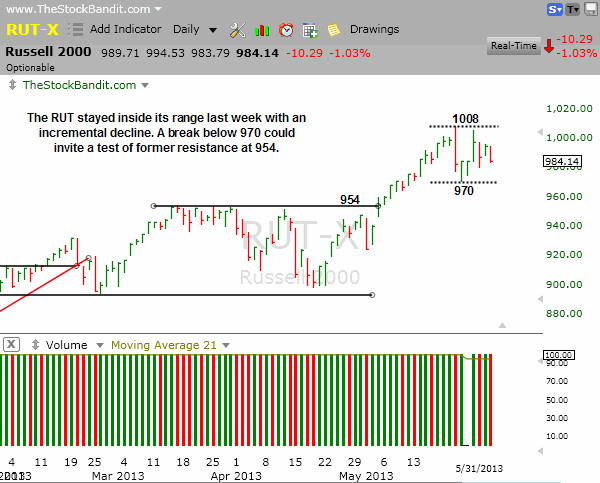
RUT – The RUT pulled back after each advance last week, ending the week just fractionally lower (-0.14). It’s still holding inside its range, but the lowest close within the range was 982, just 2 points away. This index has been resting for 7 sessions now, which is certainly healthy to see, although a deeper pullback after such a large advance from mid-April wouldn’t be a bad thing. Basically, there’s room down to the prior low of 898 to create an intermediate-term higher low. Given the price action in recent sessions, there doesn’t appear to be a big technical reason to aggressively buy this dip yet since it may not be completed.
DJIA – The DJIA closed beneath its trading range on Friday after its worst session in roughly 6 weeks. This index just failed at resistance last Tuesday and now has undercut the reaction low between the two peaks, which confirms the short-term double-top. A measured move would take this index back down to the 14818 area, which isn’t far from the former resistance level (14887) that now looks to be up next for a test.
Notable Names:
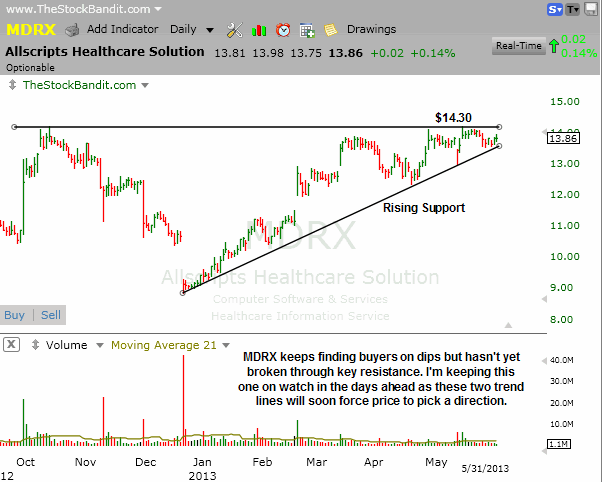
MDRX is wedging here after repeatedly finding resistance near $14.30 and each dip getting bought a bit more aggressively to create rising support. Price needs to perk up a bit to challenge resistance but it’s on my watch list.
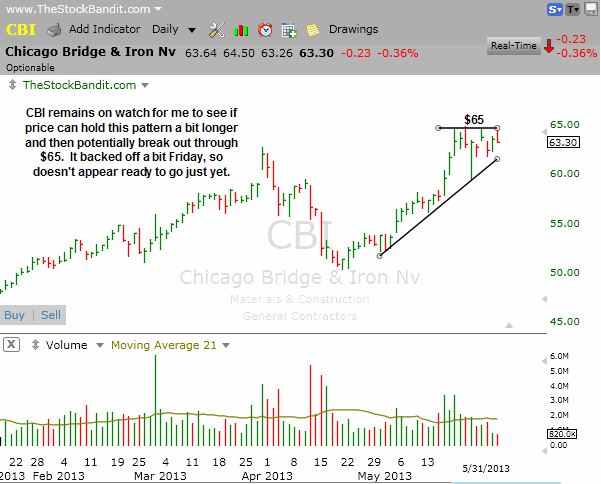
CBI is still inside its base and Friday got turned away from resistance, indicating it’s just not ready to go yet. This is another one I’m keeping on watch as it has been acting well but will need to break out before I’d get long.
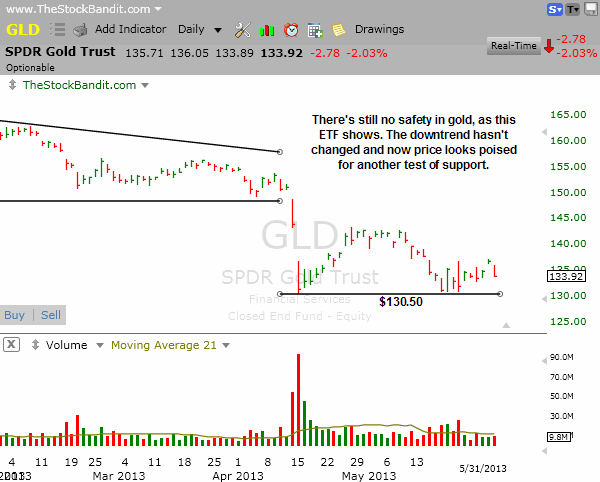
GLD is struggling to get free from support and it may be only a matter of time before another breakdown is seen. The downtrend continues and this should not be bought yet.
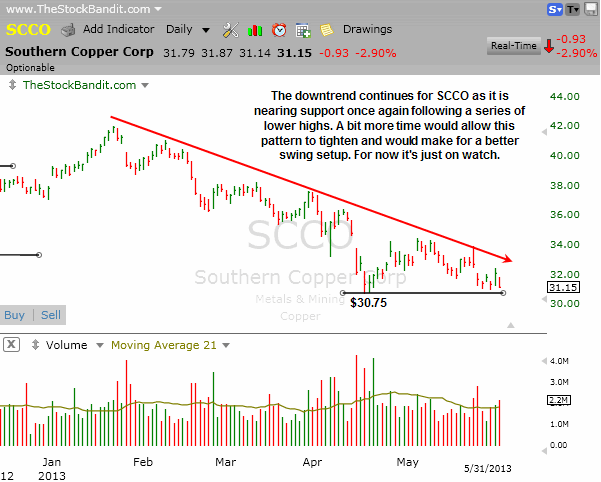
SCCO is a copper stock that’s struggling and may soon break down. Lower highs have been the norm for the past few months and that doesn’t look likely to change anytime soon.
NUS is sitting just beneath a small descending trend line here and a turn up through $59.50 could spark a quick pop. With the indexes giving mixed signals, I’m only interested in a momentum play here for Monday rather than a swing.

TSO is still inside its base as it holds above support. A turn up through $63 could set it free for a quick lift as a momentum play, although I’d prefer this base tightens further before considering a swing.

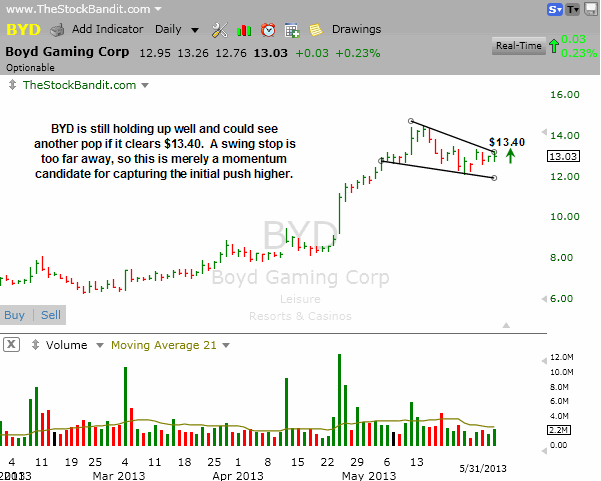
BYD is setting up again with a less steep trend line than I listed last week. A turn up through $13.40 could generate some upside interest in this stock, so I like it for a momentum play. As a swing, a stop would just be too far away.
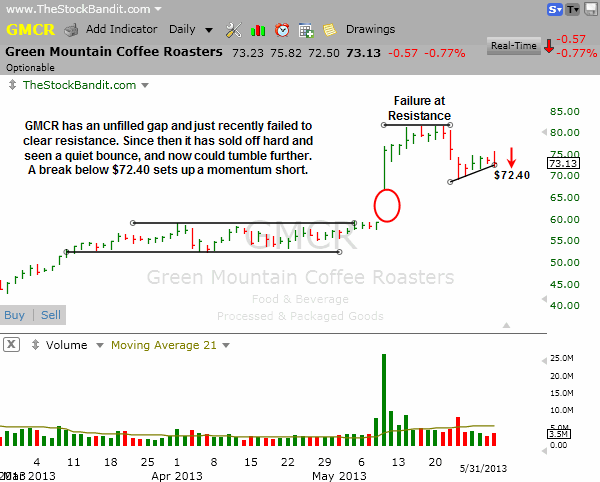
GMCR is potentially changing directions here although more technical proof is needed. A break below $72.40 could see a quick drop toward the unfilled gap from a few weeks ago. This is a momentum setup for me rather than a swing given the mixed signals over the past month.
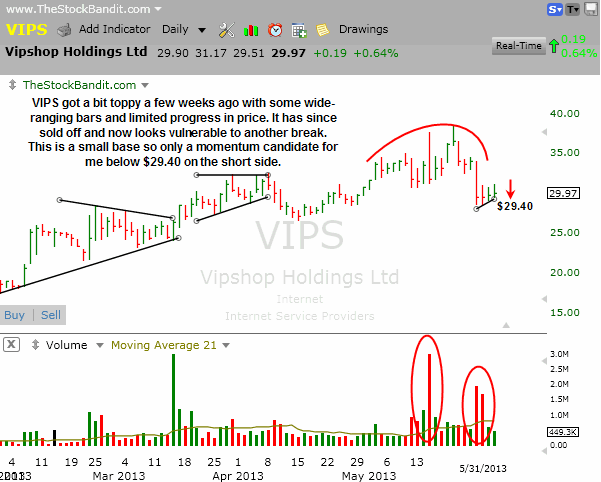
VIPS just showed some toppy price action with increased volatility and then a retreat on heavy volume. Currently it’s attempting to bounce but struggling to do so. A break of the small rising support line at $29.40 could spark some short-term selling, so I like this for a momentum play on the short side. The base needs to develop further to warrant a multi-day swing for me.
New Swing Trade Candidates:
No new swing candidates tonight, bases need to mature/tighten further to set up better risk/reward plays. Market mixed signals between large-caps and small-caps is also keeping me reluctant to add exposure. Any basing action should help with each passing day.
Bullish Watch (click for charts)
Bearish Watch (click for charts)

Trade Like A Bandit!
Jeff


