A big rally on Friday left the indexes each positive on the week after having continued their pullback off the recent highs. Thursday’s reversal off the low found more buyers ahead of the weekend with a jobs report that didn’t disappoint and another potential higher low on the daily charts.
As we head into a new week of trading, it’s time once again to take a look at the indexes and the key levels they’re dealing with. This will impact how individual names move, so it’s where every new trading week begins.
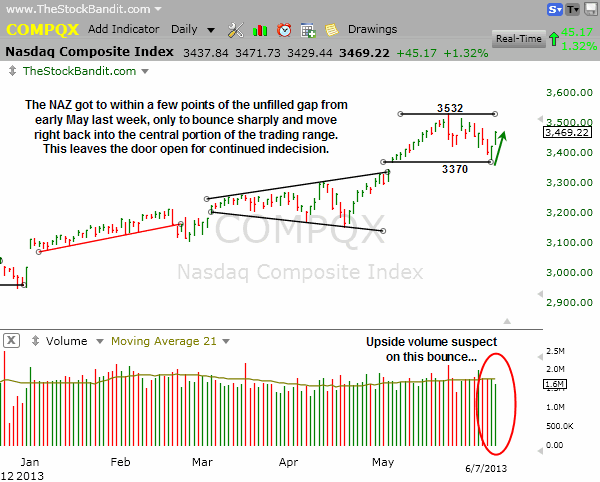
NAZ – The NAZ saw a sharp bounce off the Thursday morning low which nearly tested the unfilled gap from early May. The rebound was marked by strong finishes both Thursday and Friday, leaving this index just above the middle of the range. Stay on your toes out there as follow through right now is fleeting.
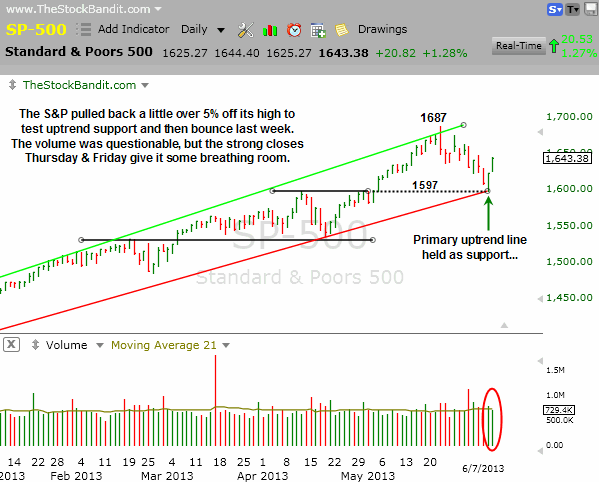
SP500 – The S&P pulled back into Thursday morning to within 1 point of the 1597 level I’ve highlighted previously. That was resistance in April which gave way to the May breakout, and also coincides with the uptrend line off the November low. That convergence plus a pullback of roughly 5.3% provided enough incentive for the bulls to step in and put cash to work once again. How far this bounce carries will tell us quite a lot in the days ahead.
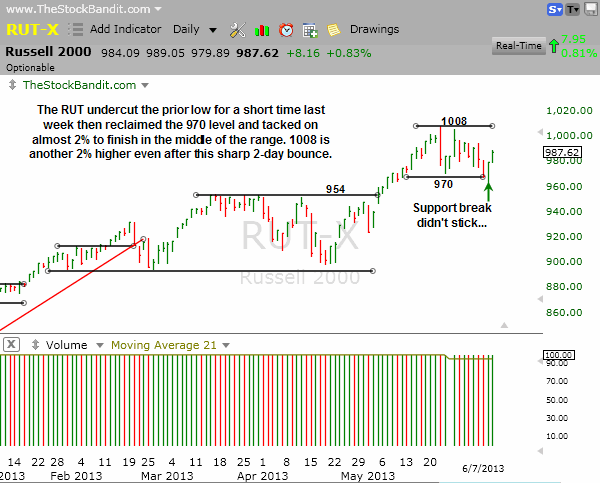
RUT – The RUT undercut the trading range low of 970 last week on Wednesday, but immediately reclaimed it on Thursday and moved higher on Friday to push back toward the center portion of the trading range. 970 is the downside zone to watch, whereas 1008 is upper resistance.
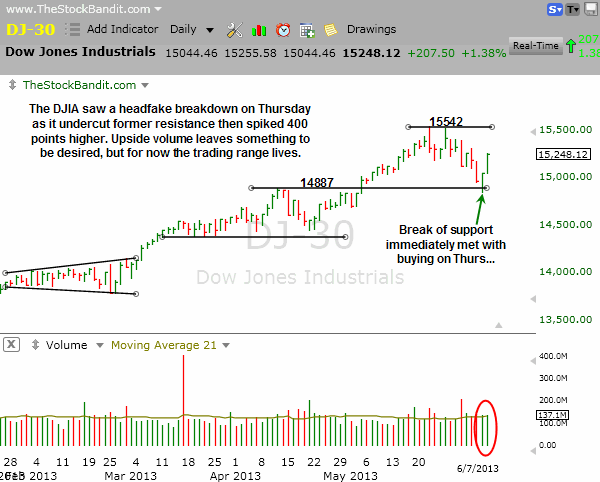
DJIA – The DJIA briefly undercut former resistance at 14887 on Thursday, spending only about an hour beneath it before reclaiming it with a sharp bounce. The lift into Friday’s close from Thursday’s low was over 400 points, putting into perspective just how sharp the lift was. Nonetheless, this index remains another 300 points shy of a new high and if this bounce stalls it could create a lower high. For now, the uptrend remains intact.
Take a trial to our Stock Pick Service to get our trades.
Trade Like a Bandit!
Jeff White


