


Good evening StockBandits!
The decline which began the previous week to carve out a lower high (vs. May) carried over into Monday last week with the indexes reaching their lowest levels since April. Having become stretched and oversold, a rebound followed with upside gaps on Tuesday, Wednesday, and Thursday. Friday finally saw some fatigue, and a late selloff capped Q2 to leave the indexes up 12-15% for the year. By the way, I found it curious that the Dow outperformed both the NAZ and S&P (each up almost 13%) for the first half. The RUT led the way up just over 15%.
So, now we’ve gotten a bounce. And it’s starting to fizzle out, which means a potential second lower high since May 22nd. More technical evidence is needed to confirm it, but the V-shaped lift from last week’s lows came on weak volume and may be stalling out. We could see some selling return this week, but the tricky part of the equation here is that it’s July 4th week. That week rivals Thanksgiving as the lightest volume week of the year. It’s an abbreviated week as well, and traders find it to be the perfect time for some R&R. That means the liquidity is worse (trade smaller!), and it’s a bit harder to ascertain technical clues due to the light volume which is so typical. This year might be different, but in general it’s a week when doing less tends to be best.
I’d like to encourage you to take some time this week or even today, not just to prep for Monday’s session with this research, but more importantly to take some time to reflect on your first half of the year. The knee-jerk reaction is to review trade results and decide if it was good, bad, or indifferent, but I’d encourage you to go deeper than that. Consider the opportunities that were there and how you dealt with them. Gauge how well you cut losses when you had them. Analyze your position size and if there were some spots where you can improve to be bigger or smaller next time. I’m looking for ways to grow from it as well, which is a must for any trader. I can assure you this will be time well-spent for you, along with reviewing your goals for the year and adjusting them accordingly – whether they’re process or results-oriented.
Let’s get to the charts.
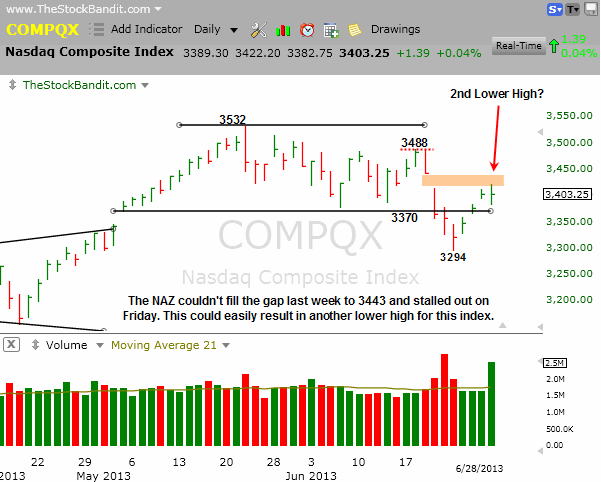
NAZ – The NAZ gained 83 points between Monday’s close and Friday’s close, yet only 18 of those points came during trading hours – the rest of the lift took place via overnight gaps. It has now stalled out shy of filling the gap to 3443, which could mean a 2nd lower high for this index. Friday’s heavy volume was end-of-quarter related, but the Tues-Thurs volume on the upside certainly wasn’t impressive.
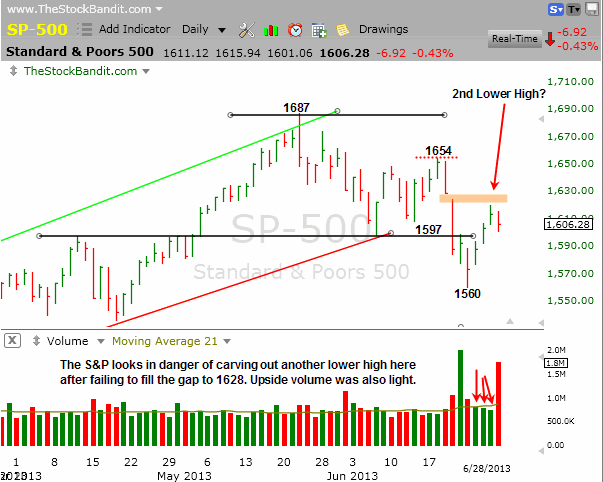
SP500 – The S&P also failed to fill its gap to 1628 last week and then turned a bit lower on Friday. 1597 has been reclaimed for now, but given the light upside volume on the bounce I wouldn’t expect it to hold for long.
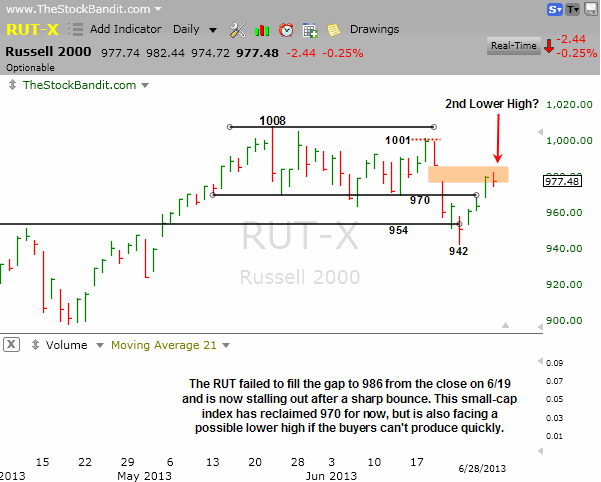
RUT – The RUT stopped shy of filling its gap to 986 last week and this could also carve out a 2nd lower high for this index. There are a few levels to watch on the way down if it sees some additional selling, but the key for now is that lower highs are in place and no lasting upside has been seen since May.
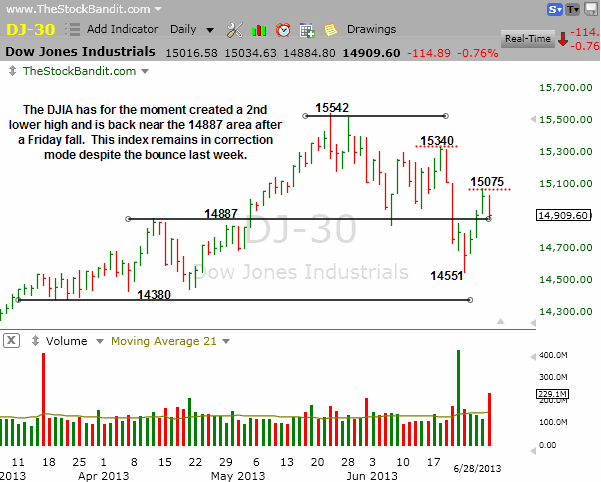
DJIA – The DJIA bounced mid-week but ended poorly to create a 2nd lower high for the time being. Last week’s low will be the real number to watch if we see more weakness.
Notable Names:
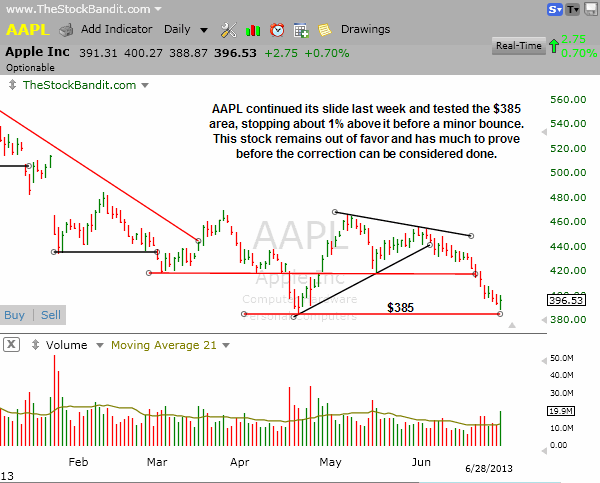
AAPL is holding key support as of Friday but still isn’t exhibiting any bullish behavior. This tech leader has been sliding gradually in recent weeks and still looks to be controlled by the sellers. I don’t expect to see $385 hold for very long, and would be in no hurry to buy this as a double bottom setup.
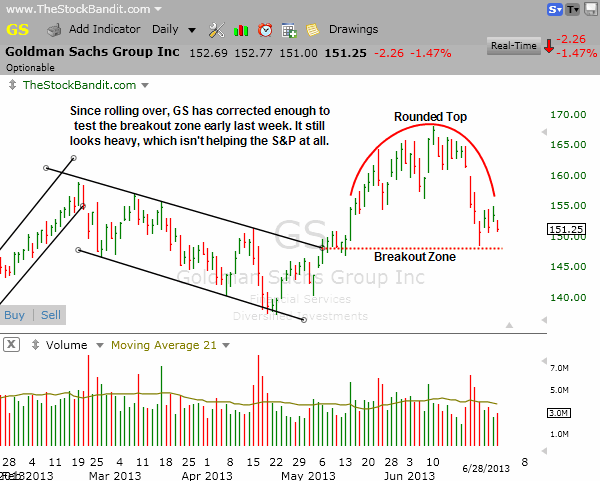
GS just rolled over and tested the breakout zone from early May. This stock has struggled of late to maintain any strength, which is setting a lackluster example for the financial sector. That also translates into weight on the S&P.
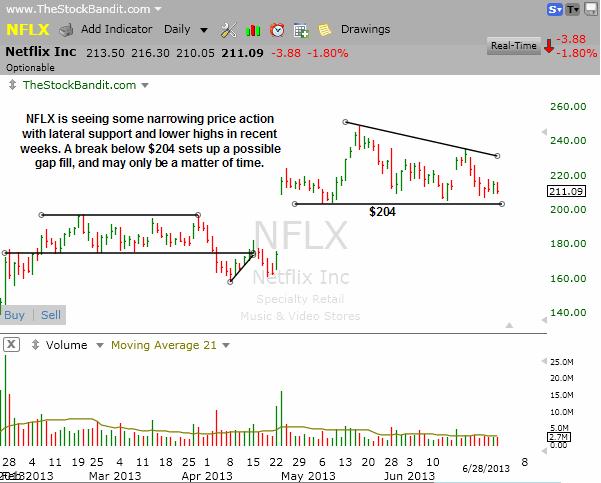
NFLX is holding above post-gap support for now but just created a lower high. That means it could just be a matter of time before we see $204 get broken. I’m taking no action for now, but will keep this one on the radar in case it slips a bit further to challenge the key level.
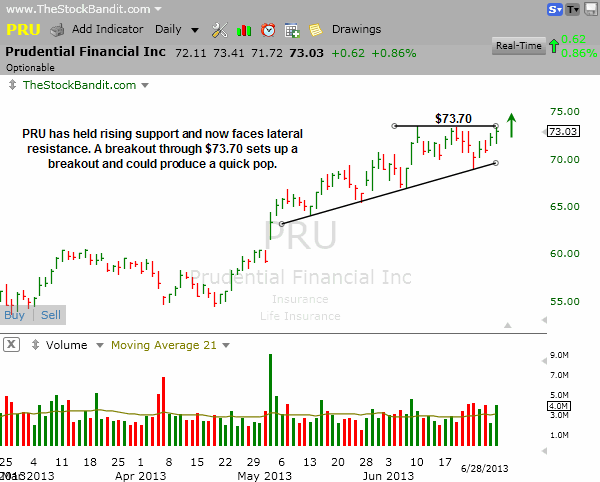
PRU is facing a breakout and has held up nicely. This is a slow mover typically, so I’m not looking for a giant move here. However, I do like it for a momentum play for Monday on the long side if it can make a new high at $73.70.
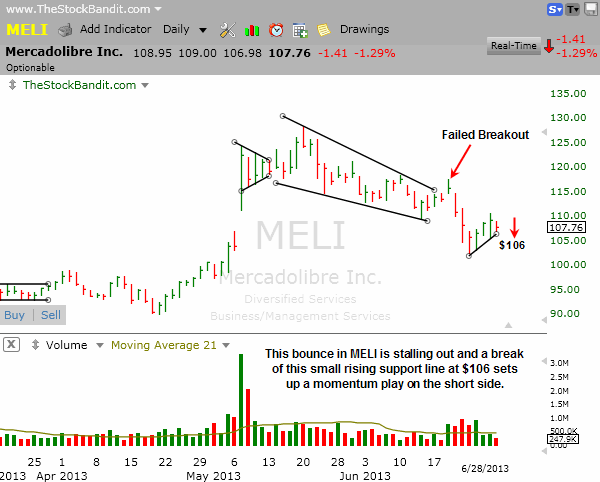
MELI is struggling to build on its bounce of the past few days and has only reclaimed a small portion of what it gave back in the slide since the failed breakout. This stock looks heavy, and I like it for a momentum play on the short side below $106. I’d prefer to see this pattern tighten up a bit more before considering it for a swing.
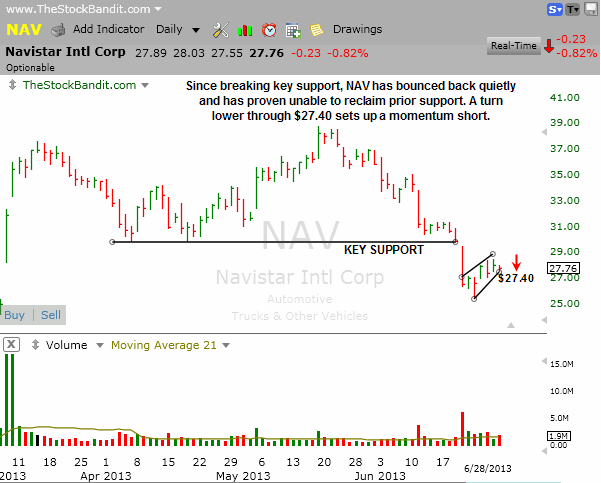
NAV is sitting in a rising channel here on the short-term bounce. A break below $27.40 could invite more selling, so I like it for a play here on the short side. However, this is just for a momentum play for me as a swing stop is just too wide at this point.
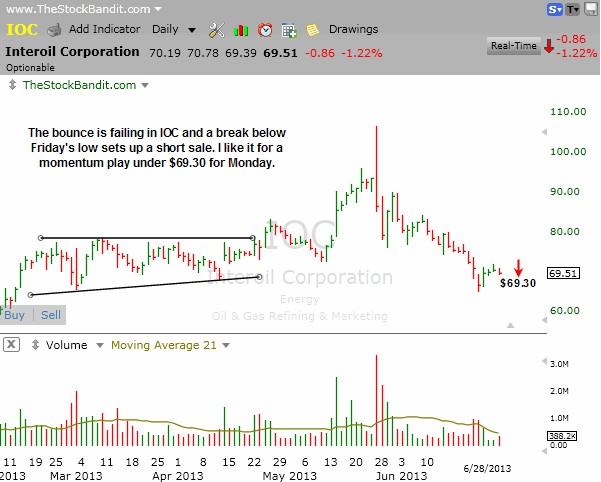
IOC is looking ripe for more selling after a hard decline and then a partial recovery last week on light volume. A break below $69.30 and I’ll take it for a momentum play on the short side. This stock is coming into a support zone from the spring, so I am not looking for a multi-day play at this stage.
LL is rolling over here after a bounce and still has ample room to sell off further. A swing stop is too wide for my taste, but I like this one for a momentum play below $77.50.

New Swing Trade Candidates:
These stocks look ready for imminent multi-day moves. Pattern confirmation occurs with a move through the entry level. Initial stop and target levels are also provided.
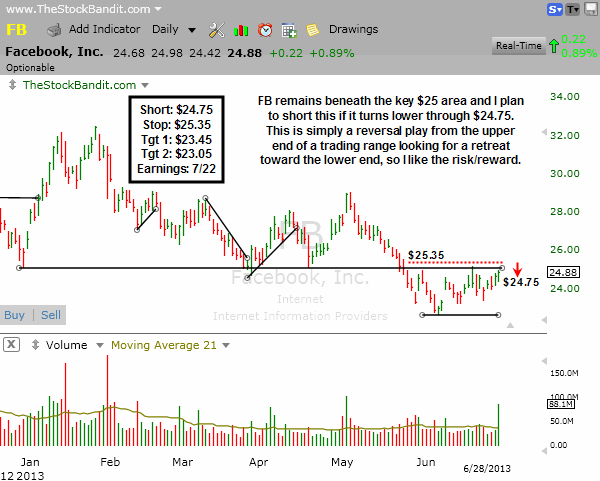
FB is back near the $25 key level after a lift within this multi-week trading range. A turn lower through the intraday level of $24.75 from Friday will trigger a short sale for me as a swing trade. I’ll have a protective buy stop above the channel just in case, but otherwise will be looking for a retreat back down toward the lower end of the range. Earnings are three weeks out, so there is time for this one to drift lower before the scheduled news (which I’ll certainly exit ahead of).
Bullish Watch (click for charts)
Bearish Watch (click for charts)

Trade Like A Bandit!
Jeff


