


Good evening StockBandits!
The market rallied further last week, shunning the seasonality reputation September is known for. It’s been a strong month so far, one of the better of 2013, and the bulls have maintained control. The main event was the FOMC on Wednesday afternoon, and the absence of tapering left stocks screaming higher – for a little while.
The excitement wore off by Thursday morning, exactly 2 hours and 6 minutes of trading after the news hit. From there, stocks started a slow grind lower into Friday’s close as traders dealt with second thoughts. Ultimately, the S&P finished just 8 points above where it had been pre-FOMC, testing the 1709 breakout level as the mean-reversion I mentioned in Wednesday’s Blueprint kicked in.
Now, we have the all-important topic of breakouts. I’ve noted many times here with individual stocks and indexes alike that a breakout just tends to stick better when some basing occurs prior to the push through the prior ceiling. When instead, prices are already stretched and push through resistance, it’s only natural for some profit-taking to follow. That of course leaves the chart with the look of an abrupt failure of the breakout, which doesn’t often instill immediate confidence. That’s the situation we now find ourselves in, particularly with the S&P. The week ahead is going to be highly important as we see whether the Thursday-Friday slide was the beginning of the end for the current run from the August low, or if instead the bulls will do what they’ve done so much of since last November – buy the dip aggressively.
From a trading standpoint, we’ve seen in the past few weeks pretty nonstop upside which has eliminated many would-be bearish charts (shorting opportunities) and has left many of the bullish opportunities looking extended (too late to buy). Now on the heels of a couple of days of downside, many charts simply look sloppy. A little basing here would go a very long way toward setting up some new plays, but as of tonight my watchlists are rather limited.
The key is always quality over quantity, so my aim is to be patient while letting new plays surface. They will, they always do, but in the meantime I don’t want to overtrade or lose my objectivity by forcing new positions. I’m holding a couple of shorts in names which have exhibited relative weakness, so I’ll stick with them until compelling plays arrive.
Let’s get to the charts.
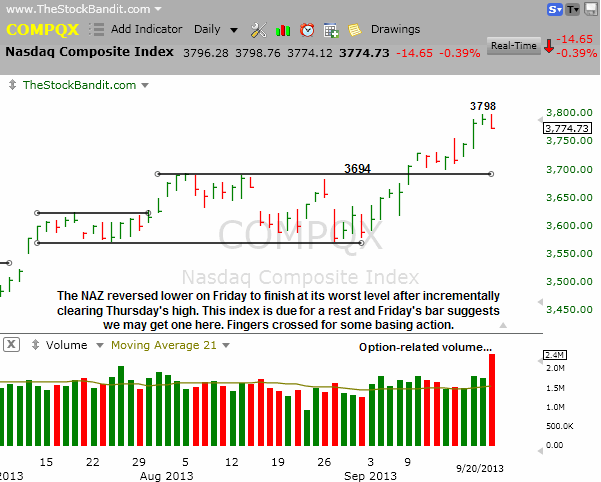
NAZ – The NAZ again reached levels not seen since 2000 last week before backing off Friday with quad-witching volume. This index has kept pullbacks limited in recent weeks but could stand to rest after this 225-point run over just 3 weeks. There’s plenty of room down to 3694 before a breakout failure. Interesting that the measured move projection to 3814 I’ve been discussing was nearly completed last week. There’s still a chance that gets completed, but Friday’s pullback suggests some rest may finally be in order.
SP500 – The S&P screamed through 1709 on the FOMC news last Wednesday afternoon but spent the rest of the week grinding right back to finish Friday right at 1709. This is the big test of the breakout and bulls won’t want to give up this level. That said, prices are still pretty extended here and some additional basing would be welcomed and healthy at this stage.

RUT – The RUT painted 2 red bars Thursday and Friday but sure didn’t give up much ground from the 1080 high from Wednesday. Any pullback could easily result in a test of prior resistance levels with the first being 1063 and the next 1056 on the way down. This index is coming off a 7.7% rally in just 3 weeks, so a little give-back would not be surprising at this stage and would actually be welcomed by bulls and bears.

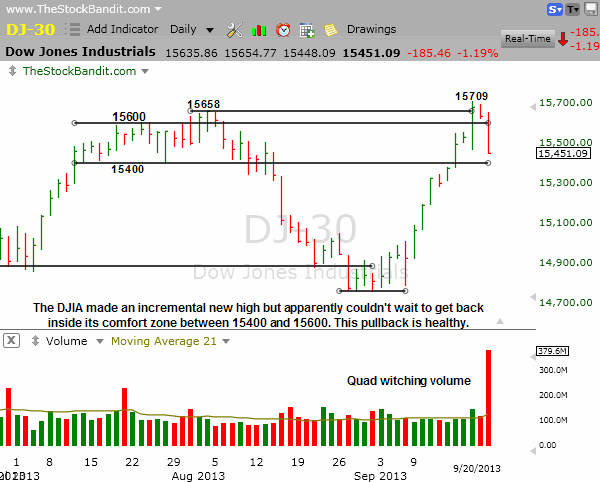
DJIA – The DJIA failed its breakout to a new high last week as it pushed just 51 points past the August high on Wednesday before reversing over 250 points into Friday’s closing bell. It’s now back inside the 200-point trading range we’ve seen it spend considerable time in this summer between 15400 and 15600. The abrupt failure of the breakout doesn’t bode well in the short term for this index, but the price action will have the final say in that.
Notable Names:
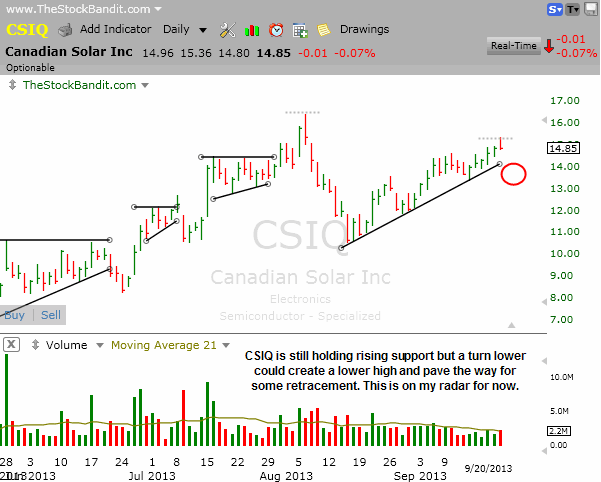
CSIQ is like some other charts tonight which is to say it’s not ready for a play but giving reason to keep it on the radar. Price has rallied along rising support for several weeks but there’s danger for any turn lower to result in a lower high. Price and the rising trend line need to get closer together but if they do, I’ll be looking for a play at that point.
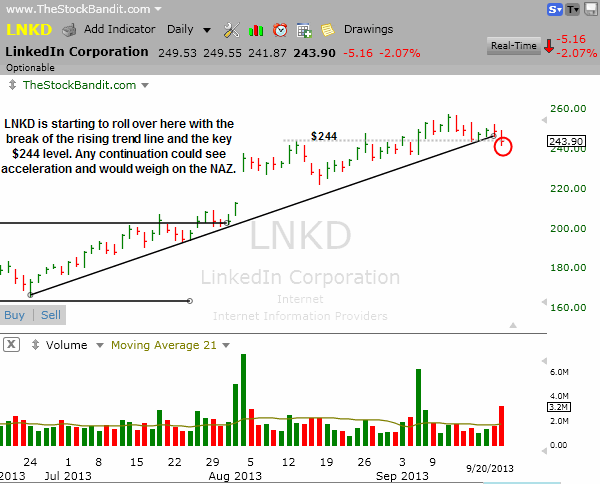
LNKD is potentially facing a change of character here with a break of the uptrend line and the $244 prior level. Any deterioration from here could see the selling pressure intensify, so this one is on the radar for some intraday possibilities based on any momentum it may exhibit. Additionally, this high-flyer has been so strong that a meaningful turn lower could weigh on the NAZ.
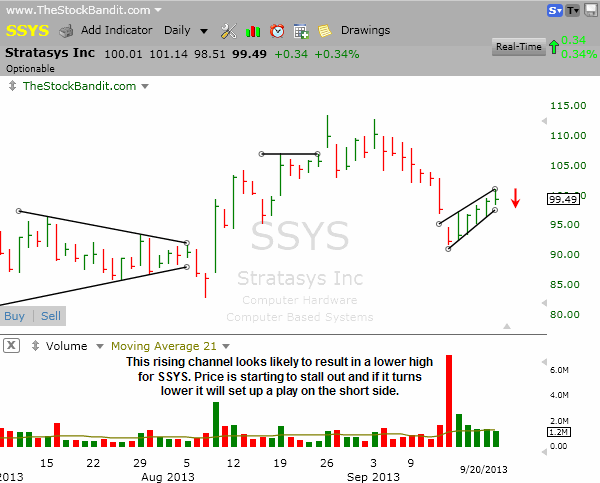
SSYS is bouncing from its recent pullback low but volume is falling off and price is beginning to stall out (note the weak finish on Friday). A turn lower could present a shortable opportunity soon, but for now I’d like to see rising support get a bit closer to price. Either way, this looks like it could easily result in a lower high on this daily chart.
FENG is perking up here after a pair of strong days which ignored market weakness. It’s now facing a potential breakout to a new high, in which case I’ll get long for a single-day play if it can cross $11.85. A swing stop is just too far away for my preference and this one actually got on the move Thursday as it gapped above the descending trend line (dashed line).

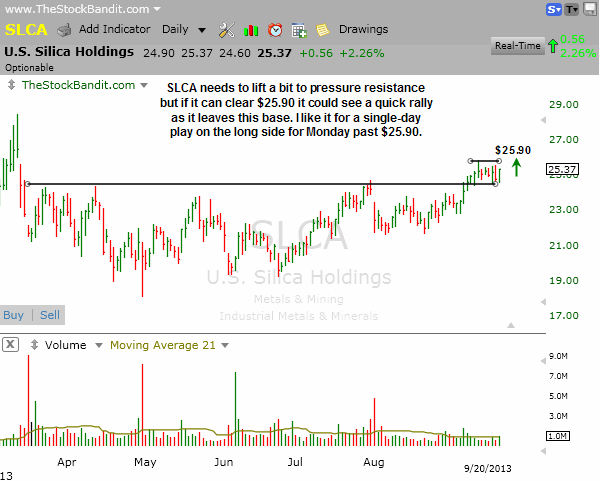
SLCA is holding above prior multi-month resistance here but not doing much else. This little base could get resolved higher, and if it does, it looks good for a play. I’d take it for a single-day play above $25.90, but it’s not quite there yet so may need more time. If it does so on Monday, I’ll give it a shot.
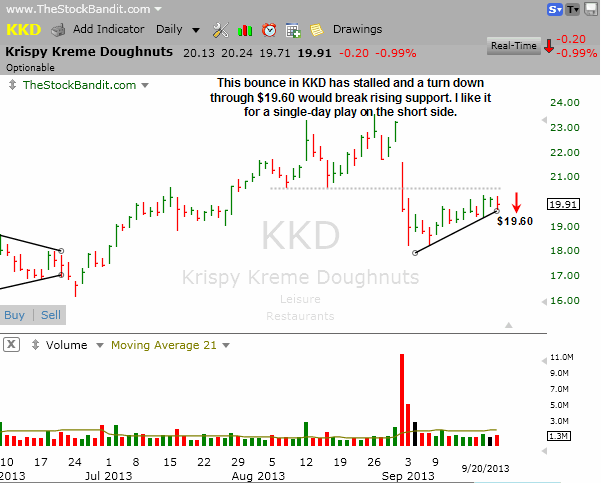
KKD has bounced back but has so far been unable to reclaim former support (dashed line). Rising support isn’t far away, so a break of $19.60 looks good as a pivot for a turn lower. I’ll take it for a single-day play on the short side if that level is broken on Monday.
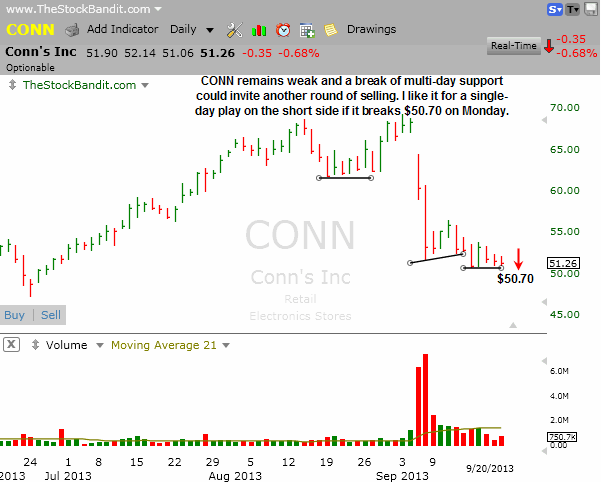
CONN is at multi-day support and remains in correction mode here. A break of $50.70 looks great for a single-day play on the short side for Monday, as the selling pressure could intensify.
New Swing Trade Candidates:
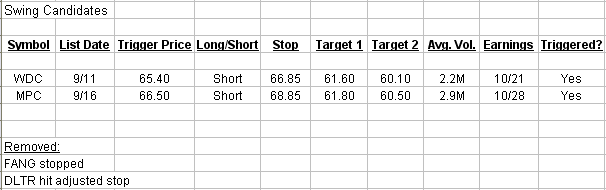
No new swing candidates tonight, waiting for better setups to emerge and sticking with limited exposure for now.
Bullish Watch (click for charts)
Bearish Watch (click for charts)
Trade Like A Bandit!
Jeff


