


Good evening StockBandits!
The indexes made some modest progress last week with the exception of the S&P, but breakout attempts failed to produce upside fireworks. The NAZ and RUT each cleared resistance only to pull back to test it, the S&P made an incremental new high only to fail the breakout, and the DJIA remains shy of the December high.
The hesitation we saw should bring some concern to the bulls here despite the fact they still have the upper hand in this market. Given the opportunity to press their edge, they chose not to, leaving us to wonder whether they’re finally fatigued or if instead it’s just a matter of time before higher prices are seen. We are getting into earnings season (be sure to watch the calendars: I prefer EarningsWhispers and Yahoo! Finance) and that could certainly be the primary market-mover in this holiday-shortened week of trading.
I’ve noticed that both my bullish and bearish watch lists have expanded, which is to say there are many stocks which could set up nice patterns or bases in the coming few days. Interestingly, both lists are of similar size, so we’ll see which way the pendulum starts to swing in terms of directional setups. Should the market happen to reverse lower, there are some bearish charts to turn to. If instead we rally, there are plenty of stocks in uptrends which could soon carve out some new pivots for new legs higher to begin.
Let’s get to the charts.
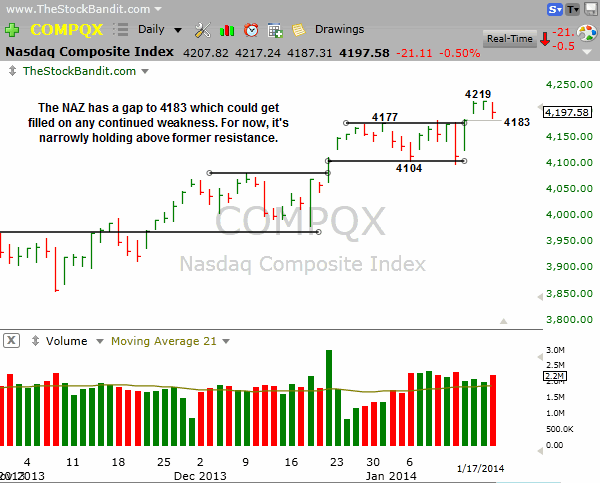
NAZ – The NAZ pulled back on Friday after 3 days of upside. The breakout could be in jeopardy if the gap to 4183 gets filled and 4177 gets broken to the downside. As of Friday’s close, there are still 20 points of cushion, but that’s not much when the S&P is heading lower within its range.
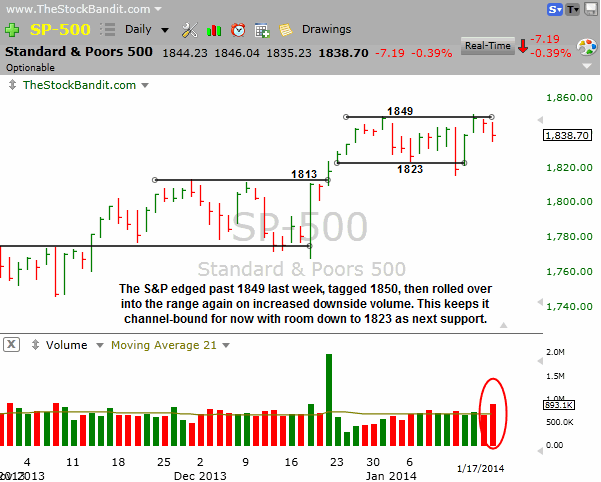
SP500 – The S&P turned away from the 1850 incremental breakout last week to finish at 1838. That’s still not far from new highs if bids strengthen, but for now the breakout attempt has failed and next level to watch is 1823, the low end of the range.
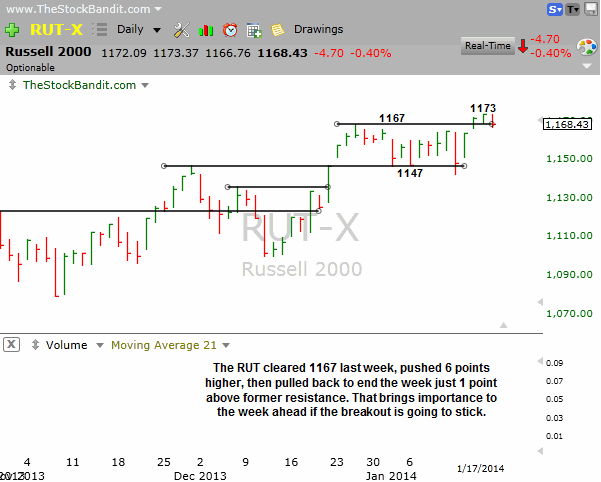
RUT – The RUT held its breakout by just 1 point on Friday with a pullback that stopped just above former resistance. The 20pt range breakout could bring a measured move to 1187, but not if the breakout fails here. Any turn lower and there’s a gap to 1163 from the close last Wednesday, followed by 1147 (the low end of the range) as next support levels.
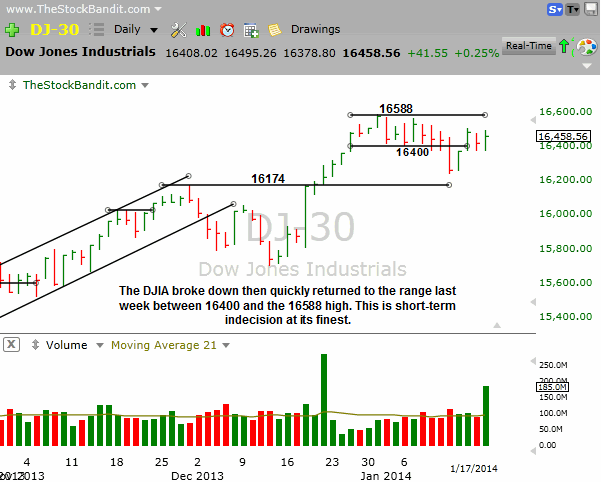
DJIA – The DJIA didn’t come close to a breakout attempt last week thanks to a hard selloff Monday out of the short-term range. Prices reclaimed the range by Wednesday, but simply churned from there. Until 16588 is cleared, the path of least resistance here is not up.
Notable Names:
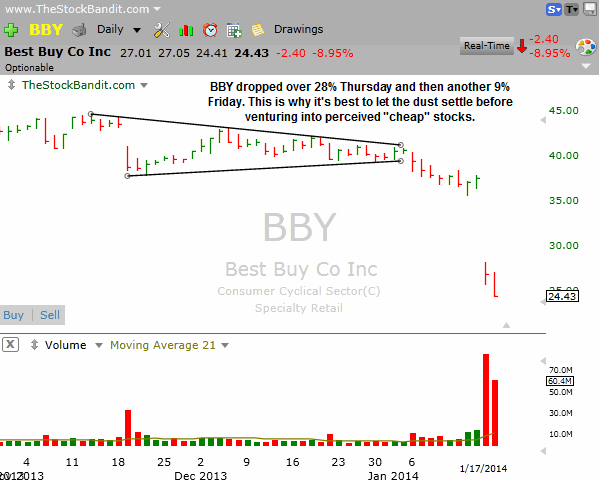
BBY cratered on Thursday after the company reported light holiday traffic and sales. Seeing a major stock shed almost 30% overnight brings out the bargain-hunter in many, but it’s usually best to let prices stabilize before looking to make a purchase. Friday’s action saw prices slide another 9%, so give this one some time.
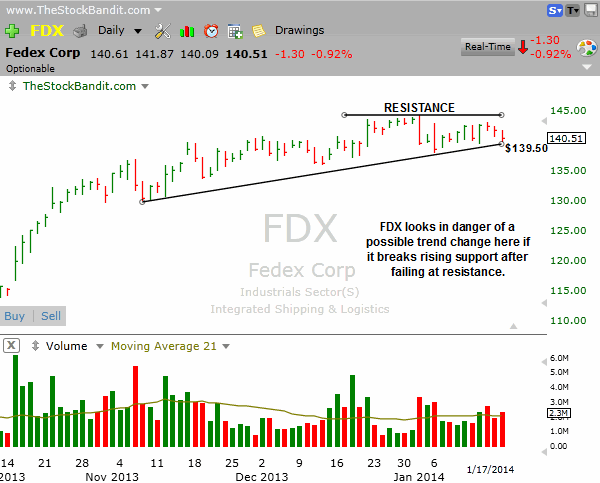
FDX is hugging rising support after failing at resistance in recent weeks. A downside break could spark a trend change after a big run in this stock, so it’s on my radar this week. I’m not so eager to capture the initial turn lower as I am intent on waiting for a lower high to be confirmed. Once that happens, more aggressive selling can take place.
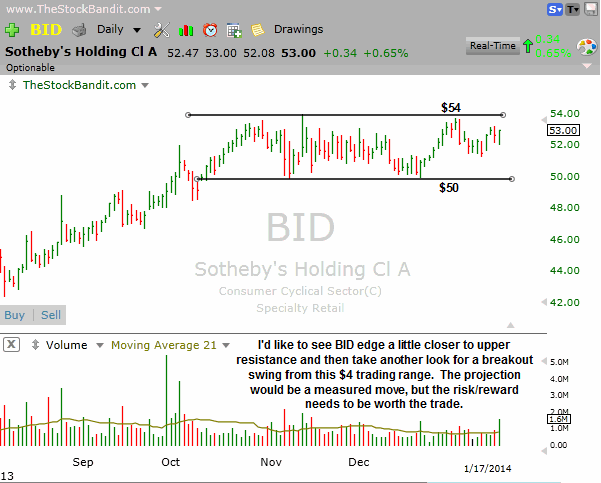
BID is trying to turn higher within its range but price isn’t yet pressuring upper resistance to indicate an imminent breakout. I’m keeping this one on my radar to see if that can happen, along with some tighter support to possibly set up a breakout swing in the days ahead. For now it needs more work.
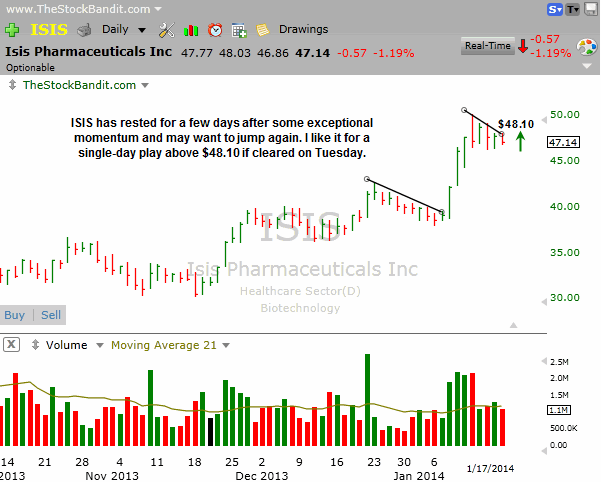
ISIS looks set for another potential pop but price will need to clear the trend line at $48.10 to get going. I’d like to let this base tighten another day or two before considering it for a swing, as I’m very picky with biotechs. If it goes on Tuesday, I’ll just take it for a single-day play and be out no later than the closing bell.
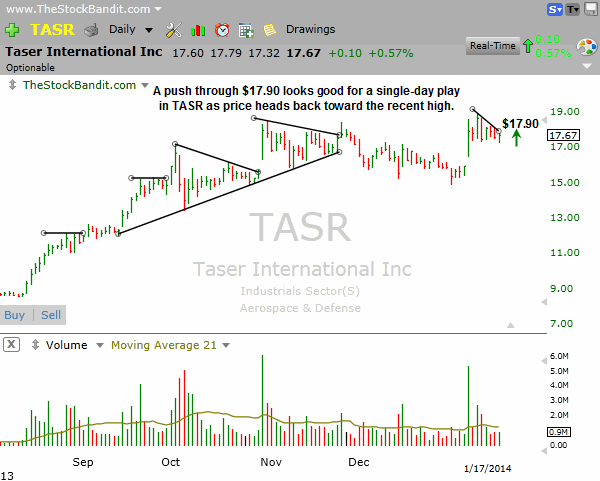
TASR is trying to turn back up here and a push through $17.90 looks good for a single-day play as price tries to turn back up toward the recent high. That would give it about $1 of upside.
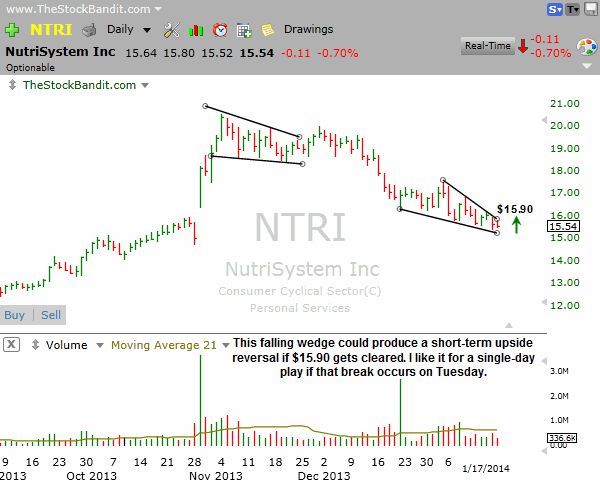
NTRI is sitting in a falling wedge pattern which could produce a short-term upside reversal if price clears the upper trend line at $15.90. I’ll take it for a single-day play on the long side Tuesday if that occurs, but it’s not my play to initiate a long swing in a stock that’s still caught in a downtrend. For a swing scenario, I’d want to see more constructive price action and some bullish characteristics like higher lows and stronger upside volume.
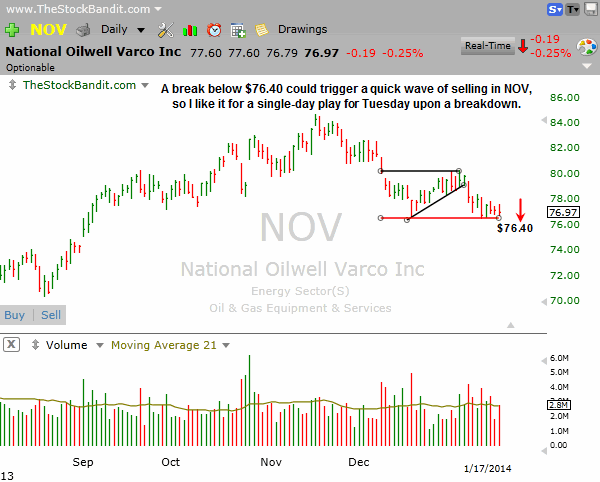
NOV is facing key support and would be making new multi-month lows if it breaks down. I like this one for a single-day play below $76.40 to participate on the short side in the initial break of support if it happens on Tuesday.
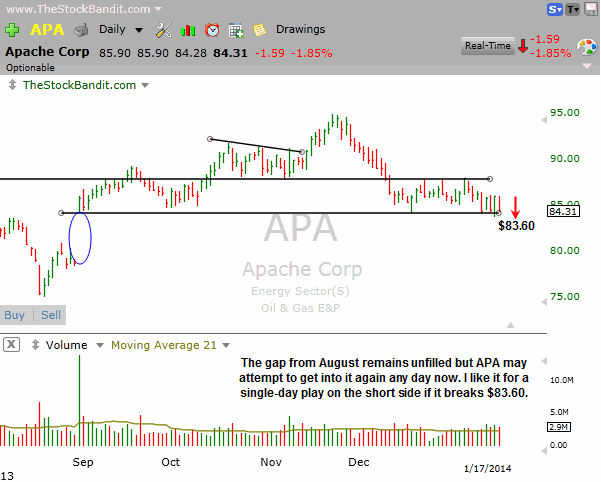
APA tried to go last week but didn’t produce. I’ll give it another shot here if it makes a new correction low at $83.60 to start filling the gap from late August. This will be a single-day play for me if it goes on Tuesday, as a swing stop isn’t real clear and price has shown some hesitation to break down despite having some opportunities lately.
New Swing Trade Candidates:
No new swing candidates tonight, bases need a little more work to further validate levels and improve risk/reward profiles via tighter patterns.
Bullish Watch (click for charts)
Bearish Watch (click for charts)
Trade Like A Bandit!
Jeff


