


Good evening StockBandits!
The bulls maintained their edge last week with modest gains across the board, pressing the NAZ, RUT, and S&P all to new multi-year (or all-time) highs. The strength which has been so persistent since the turn back up from the October 9th low is certainly still present, although we did see it decelerate just a bit. Not only were the gains smaller from the previous week, but we also saw a few finishes off the session highs in several sessions last week.
At this point, the averages are sitting well above their recent pullback lows and remain stretched. That’s making for a tough environment for trading, as bearish charts just aren’t very prevalent and bullish charts in many cases just look too extended here to chase. Every day of basing is helpful to not only digest this huge advance, but also to help establish some short-term levels and patterns from which new trades can be made.
There are many who are eager to call a top after a move of this magnitude, but momentum doesn’t die easily. The bulls have repeatedly been rewarded for buying dips this year, so it will take more than a little bit of weakness before they lose faith. The bears also have no confidence due to the lack of downside follow through, which is keeping them on the defensive by making them buyers on strength to exit losing short positions. There’s also ample room for a pullback here to create yet another higher low, so the point I’m making here is simply to stay mindful of the existing trend because even if it’s slowing a bit it could still be a long way from done.
Just as a reminder, earnings season is well underway and it’s a good idea to keep some earnings calendars bookmarked for easy reference in order to avoid any surprises with stocks you may be considering holding overnight. I like EarningsWhispers and Yahoo! Finance and keep them handy this time of year.
Let’s get to the charts.
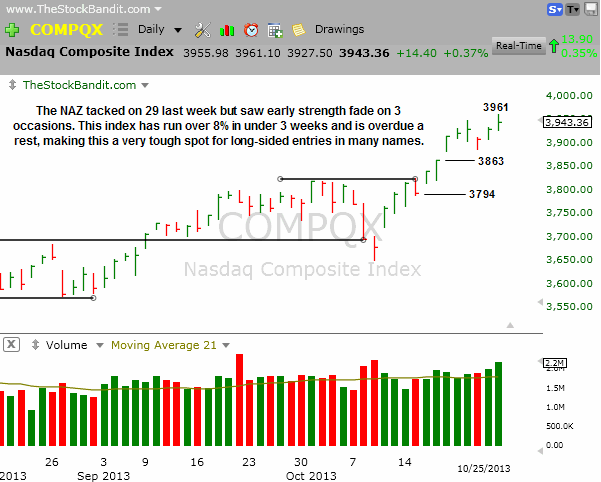
NAZ – The NAZ saw upside opening gaps get filled on 3 days last week, showing that there is at least some desire right now to lighten up into strength. However, it gained more ground on the week, adding 29 from the prior week. There are a pair of unfilled gaps down below which could get targeted on any weakness. On the upside, this index is now just 1% away from 4000. The sloppier appearance of the past several sessions lends some credibility to the idea of some rest arriving soon, but so far we’re still waiting for it to begin.
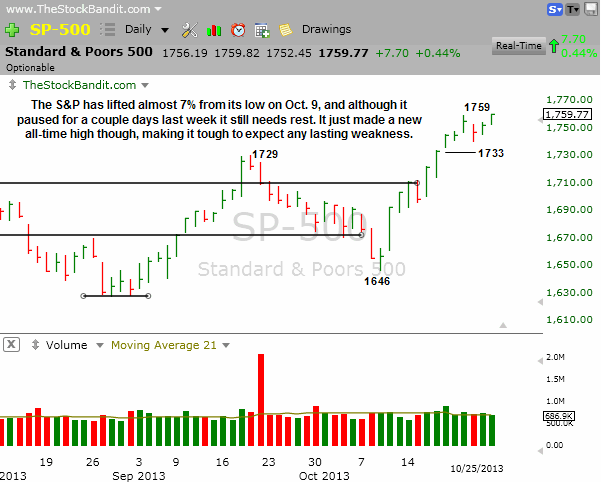
SP500 – The S&P challenged 1759 a pair of times last week after a Wed/Thu pause, and added 15 points on the week. The prior high was 1729 and there’s an unfilled gap to 1733, both of which are levels to watch should we happen to see some selling. The short-term, intermediate-term, and long-term trends all remain up, making it difficult to become bearish here. By the same token, following a 7% lift it’s tough to chase, which means it’s a time to stay selective.
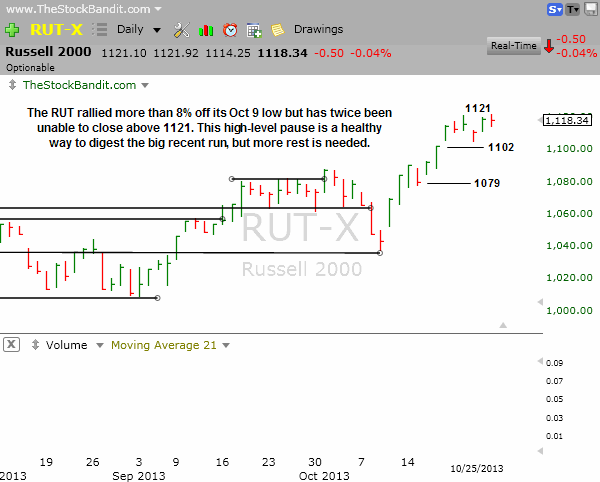
RUT – The RUT reached for another new all-time high last week at 1121, but twice was unable to close above it. This index only added 3 points on the week, so it was finally able to put in some lateral rest. Should some selling arrive, I’ll be watching 1102 and 1079 as unfilled gaps on the downside which could be eventually tested on a pullback. This index has just rallied 8%, so it has plenty of room to pull back without threatening the October low of 1037.
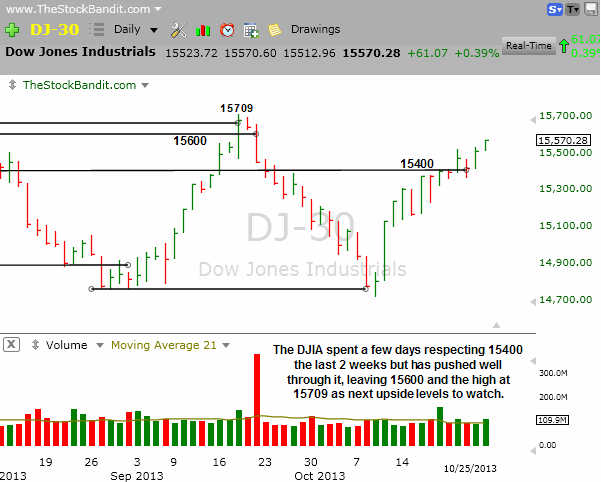
DJIA – The DJIA tacked on 153 for the week and was able to put 15400 in its rearview mirror for the time being. Next levels to watch on the upside are 15600 (July resistance) and 15709, the all-time high. Having lifted nearly 6% from its October low, this index has seen a sizeable move already and therefore may respect the September high for a little while longer.
Notable Names:
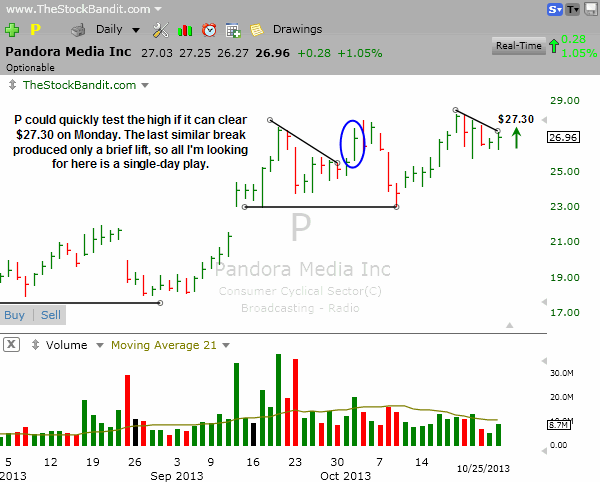
P is sitting just beneath a small descending trend line tonight after a mild pullback from its high. A turn up through $27.30 looks good for a quick rally back to test or exceed the high, so I like this for a single-day play to participate in the initial turn higher if it happens on Monday. Note the prior turn up through a similar trend line saw only a quick rally before the strength faded, so I’m staying mindful of the recent rhythm of the stock and looking for a similar move.
WLT is a very nice setup and I love how many tests of the same level we’ve seen going back to the spring. Since being broken as support, the same level has now become resistance. A turn up through $16.35 looks great for some acceleration to the upside, but this will only be a single-day play for me given the fact that earnings are due out on Wednesday this week.

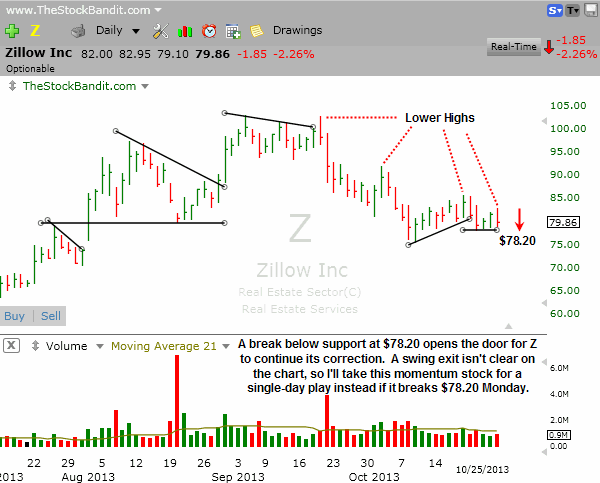
Z has created a series of lower highs and tonight is sitting just above multi-day support. A break below $78.20 looks good for a single-day play on the short side as more selling kicks in. A well-defined stop for a swing isn’t present, which is why this isn’t a swing setup for me.
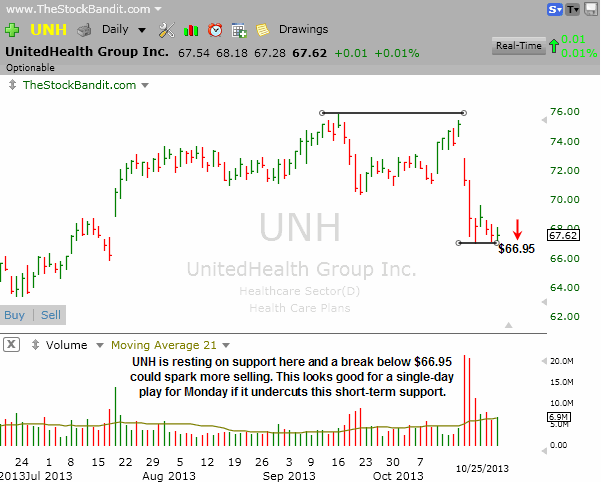
UNH just failed at resistance a couple of weeks ago and now is sitting in an ‘h’ pattern with a sharp decline, a minor bounce, and a small retreat to leave price resting on support. I like these plays for quick breakdowns, so I’ll take it for a single-day play on the short side Monday if it undercuts $66.95.
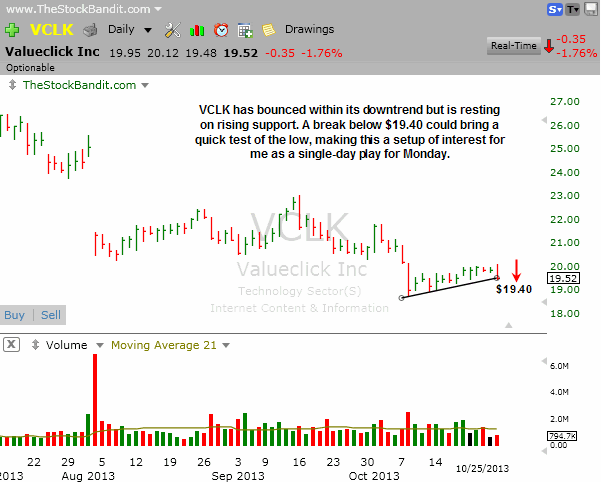
VCLK is hugging rising support here after a bearish engulfing bar on Friday. A break below $19.40 could bring a quick test of the low, so I’ll look to take it on the short side for a single-day play for Monday if that break occurs. The risk/reward for much more than that just isn’t very appealing, plus the last break of support only lasted a day back in early October.
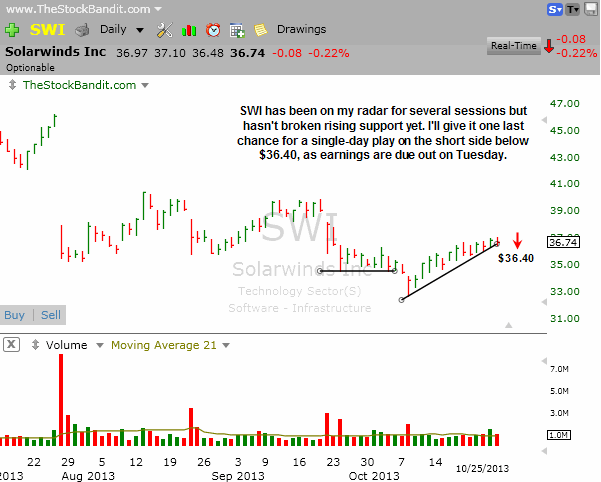
SWI is set to report earnings on Tuesday but I’ll give it one more chance for a play on the short side if price breaks rising support at $36.40 on Monday. I won’t be holding it overnight though as I don’t take positions into earnings announcements due to the fact I am unable to control my risk.
New Swing Trade Candidates:
These stocks look ready for imminent multi-day moves. Pattern confirmation occurs with a move through the entry level. Initial stop and target levels are also provided.
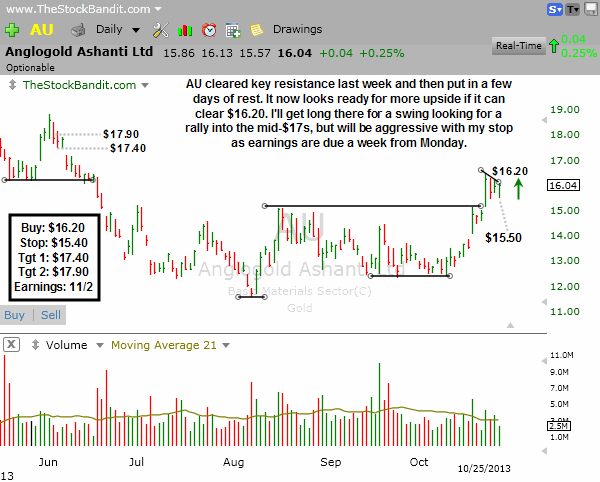
AU just broke above multi-month resistance last week and held. There’s now a small trend line I’ll be using as a pivot for getting long if price clears $16.20. A turn up could bring a rally toward the unfilled gap from June. Earnings are due out next week, so if this one triggers I’ll be aggressively tightening my stop due to the narrow window of time it will have to work.
Bullish Watch (click for charts)
Bearish Watch (click for charts)

Trade Like A Bandit!
Jeff


