


Good evening StockBandits!
The major indexes essentially painted inside days on their charts today by respecting Friday’s trading ranges. Tech buyers showed restraint ahead of the earnings announcement by AAPL after the bell, and overall there was just a lack of real momentum. The FOMC meeting on Wednesday and the big run we’ve had both give reason for holding back on big bets, particularly when even the bulls recognize the need for some rest here.
I touched last night on the notion that a dip could be kept relatively shallow, but want to expand on that idea a bit. Given the rewards the bulls have enjoyed every single occasion in 2013 for buying dips, they’re unlikely to shy away and they’re bursting with confidence. They’ve been conditioned to do it, and it will take a failure or two before they change their ways. We’ve seen no failures yet. Meanwhile, the bears have been punished relentlessly on the way up and have zero confidence, so they are also aggressive buyers into any weakness as they sense a short-term opportunity to exit short positions which are simply not working (generally speaking). This makes both camps buyers into dips, which is why I just don’t see a lasting selloff even if we do happen to turn lower from current levels. Toss into the mix the money managers and funds which have underperformed this year, and you have yet another crowd who is aggressively buying in hopes of making up some ground as the end of the year fast approaches.
So, there’s a quick discussion on the dynamics of strength. I’m not suggesting that the market is topping here, but even if it is, let’s consider the topping process for a moment…
The fact is that tops tend to be much more of a process, and we’ve not yet seen evidence of one beginning. Yes, the current rally is long in the tooth, but that doesn’t mean the market suddenly tanks from here. There might be a catalyst, but coming right off the top we’re still likely to see a dip or two get bought even once “the top” has been painted, making it something that will likely take some time even after the process is set in motion. So as you see predictions out there to the effect of sell everything and get short, take them in stride. I’m in agreement that selling into strength is wise, and lightening up will free up capital you can put back to work at lower levels once a correction happens.
It’s definitely tough finding new buys right now to add long-sided exposure here, plus with the need for some rest it’s not what I deem to be a wise spot for getting long, no question about it. That’s why I’ve been so selective of late. But trying to short into strength at highs is just inferior to shorting after a top has been created and follow-up bounces begin to fail. Take note of the distinction!
Let’s get to the charts.
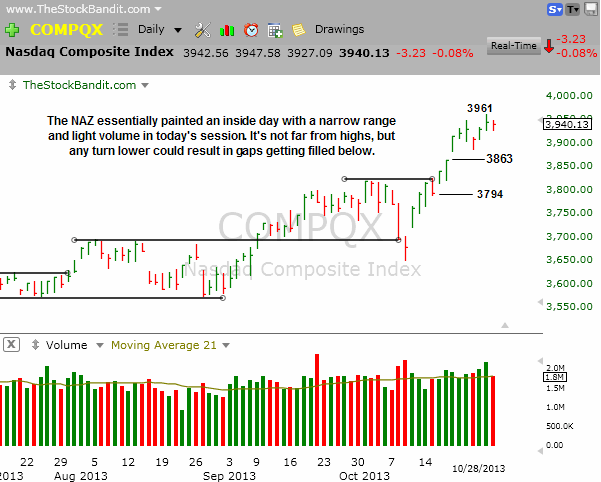
NAZ – The NAZ drifted laterally today in a 20-point intraday range, finishing lower by just 3 points as volume contracted. This equates to a day of rest, and more is needed as price levitates some 300 points above where it was less than 3 weeks ago. Any turn lower will bring my attention to unfilled gaps at 3863 and 3794, respectively. It’s important to note that even if both gaps get filled, the overall uptrend would not be threatened at all.
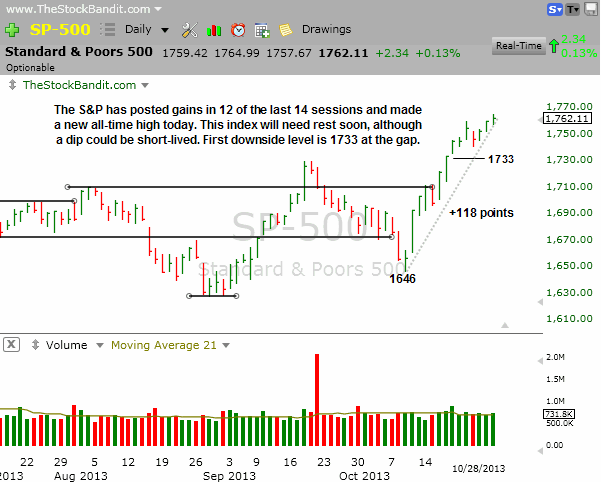
SP500 – The S&P extended its run incrementally today with a minor gain of just 2 points. It’s been quite a run from the October 9th low at 1646, and at some point we’ll get a pullback, it just hasn’t happened yet. Any turn lower and I’ll be watching 1733 where an unfilled gap stands, followed by the September high of 1729.
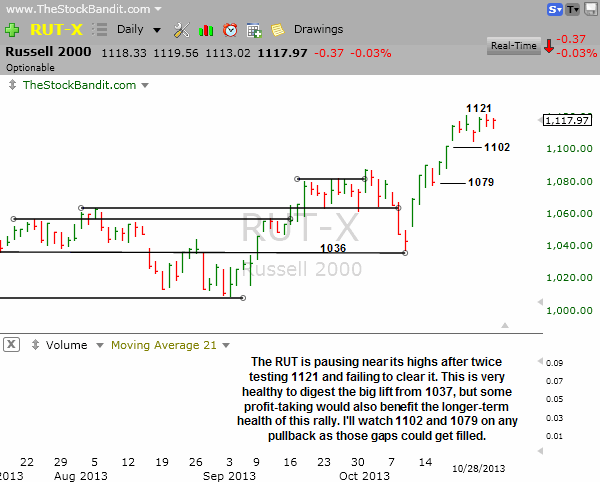
RUT – The RUT has respected 1121 for the past week with two tests, and is trying to base/rest over the past several sessions. More lateral movement or some profit-taking would be healthy to see, and I’ll watch the gaps at 1102 and 1079 as levels that may get tested if a dip arrives.
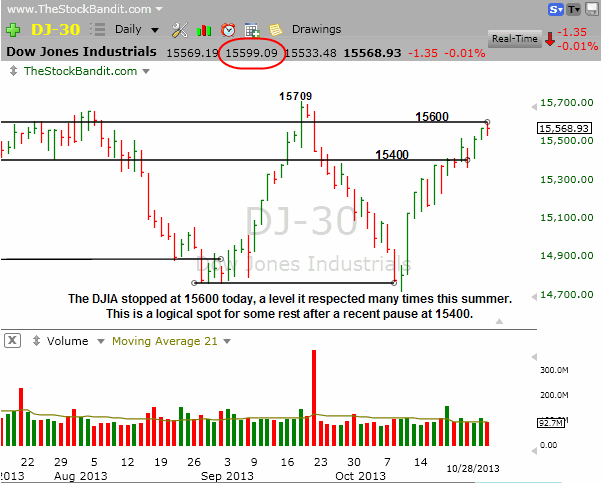
DJIA – The DJIA spent considerable time between 15400 and 15600 in July and August. On the rebound from the test of August support, we’ve seen this index respect 15400 with a short pause there and then today it got within 1 point of 15600 before backing off slightly. This index could keep going and test the high, but for now it’s respecting another key level and that provides it with a logical spot for some needed rest.
Notable Names:
NFLX is still in an uptrend despite seeing a hefty pullback off the post-earnings gap high from last Tuesday. Today it turned lower, but rising support is coming into view and should be considered by anyone eager to short this high-flyer. Stated otherwise, the uptrend hasn’t been broken yet.

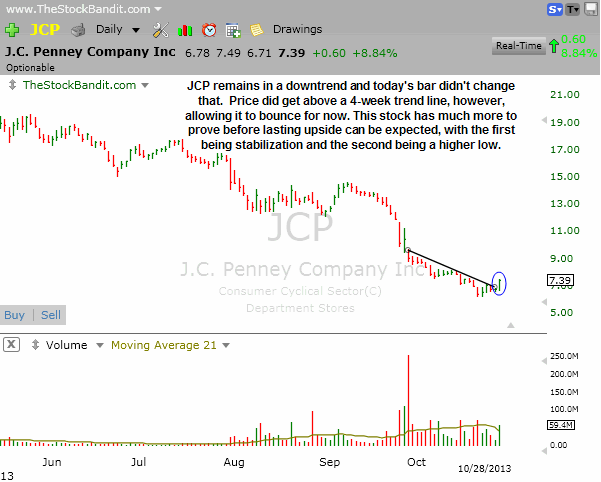
JCP has been brutally punished in recent months and today suddenly put up a 8.8% gain. This coincided with a descending trend line break, allowing price to temporarily lift from deeply oversold conditions. Here again, the primary trend remains intact so a counter-trend play (long) should be kept on a very short leash. We could see a violent snapback here, but much more technical work is likely needed for this stock to carve out a lasting bottom.
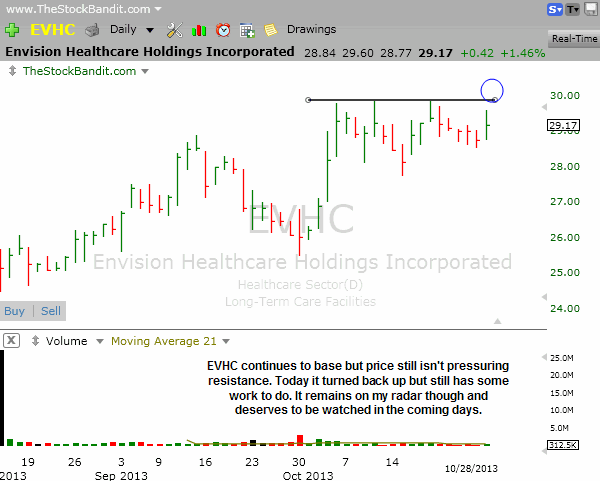
EVHC is still on my radar as price continues to base beneath key resistance near $30. Today price turned back up, but didn’t see a very convincing finish by ending $0.43 off the session high. It looks like it still needs more time, but it’s one to keep an eye on as another 1-2 sessions and it could be facing a breakout.
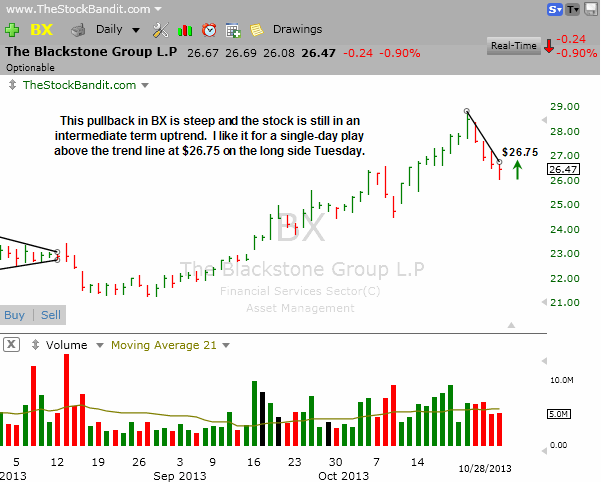
BX pulled back today for the 4th straight session but was able to lift from its session low. There’s now a steep descending trend line I’m watching for a possible upside break. It looks good for a single-day play on the long side if it can clear $26.75 on Tuesday.
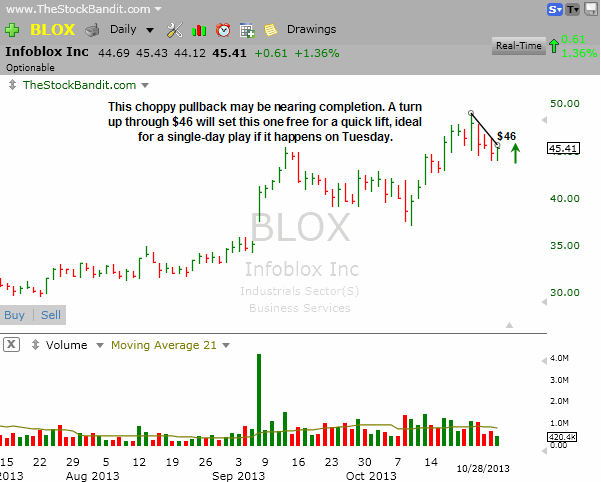
BLOX has retreated from its recent high and tried to stabilize today. A turn up through the small trend line at $46 looks good for a quick pop and possible test of the recent high, so I like this one for a single-day play heading into Tuesday’s session. Upside volume today was lacking, which diminishes my interest in a swing, aside from the recent indecision price has shown.
TSLA has been grinding lower with bounces getting sold in recent weeks. Key support (former resistance) is around $158 and is coming into view. A break below $157.50 would be a decisive break of that level and could easily spark some quick selling. This is a momentum stock and a swing would require a very wide stop. Instead, I’ll just take it for the initial breakdown as a single-day play.

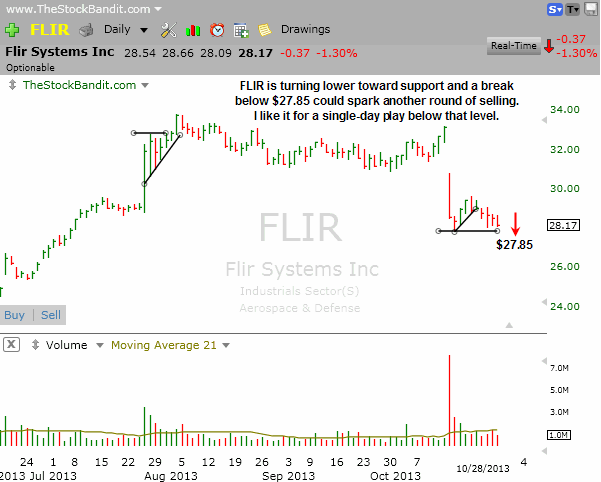
FLIR is drifting back toward short-term support here and a break below $27.85 could trigger another wave of selling. I like this setup for a single-day play on the short side for Tuesday if that level gets cracked, but a swing stop isn’t very defined here so I won’t be holding it overnight.
New Swing Trade Candidates:
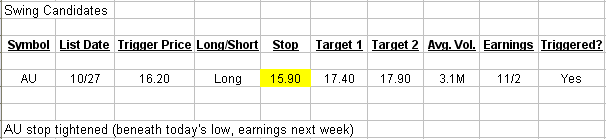
No new swing candidates tonight, waiting for higher-quality bases and patterns from which to establish multi-day plays.
Bullish Watch (click for charts)
Bearish Watch (click for charts)
Trade Like A Bandit!
Jeff


