


Good evening StockBandits!
The main event of the week took place today with the FOMC meeting conclusion and accompanying policy statement. After a modestly positive start this morning, stocks turned lower into negative territory before the Fed, but the lack of new news prevented that from changing as 2pm ET arrived. As a result, the indexes retreated a bit further after the headlines to finish in the red – a color we haven’t seen much of lately. Ultimately, no real technical damage was done as the declines were kept in check and essentially all that has happened so far is a small retreat from the highs.
A pullback here – even if it’s shallow and brief – will go a long way toward improving the condition of the charts out there. That goes for the indexes and many individual names alike, as there has just been such one-way price action the past few weeks that it has left a ton of charts looking strong but simply too extended to chase. Any dip or pause in the advance allows for new short-term bases to form, as well as some levels to be established on the daily charts. That also helps to alleviate the overbought conditions we’ve seen lately, giving the market a chance to digest the recent run in a little healthier way.
I’ve been light on my feet lately due to the price action allowing for so few quality setups, but as we get some rest and earnings season gets more behind us, I’d expect to see many more swing trades setting up. As more arrive, I’ll definitely be sharing them here. In the meantime, I’m trying to take what the market is offering by way of cash-flow trades and of course the few swings I’m seeing.
Remember… if you have a couple of tickers you’d like to submit for tomorrow’s Charts on Demand video where I take a look at your charts, send them in. You can reply to this email and I’ll do my best to put it on the list. I’ll likely record the video shortly after lunch as I’ll be heading out shortly after the closing bell.
Let’s get to the charts.
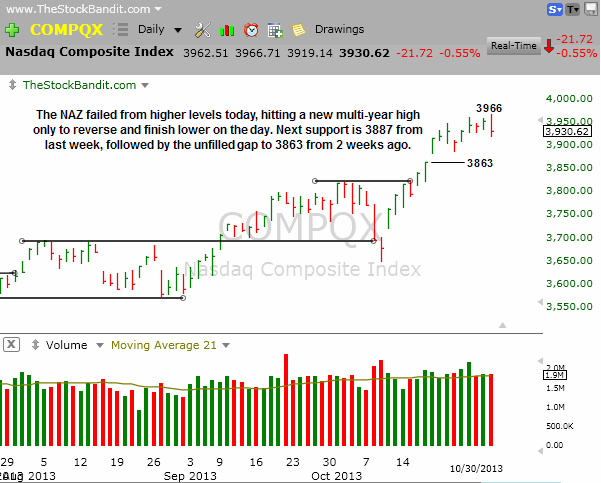
NAZ – The NAZ made an incremental new high this morning at 3966, just 5 points beyond the high from last week. It then reversed lower to paint a bearish engulfing bar. That’s somewhat due to the very narrow range bar yesterday, but either way it points to some hesitation here to continue north. This index needs rest and each day is helpful at this point. Any continued weakness from here could target last week’s low at 3887, followed by the unfilled gap to 3863.
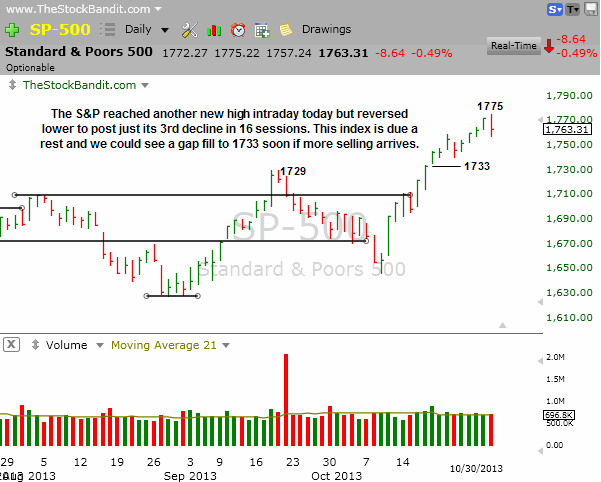
SP500 – The S&P also tagged a new high today (all-time) before reversing lower to finish slightly in the red. This index is badly in need of rest, and any sideways to down price action would help to digest the massive run this index just made off the Oct. 9 low of 1646.
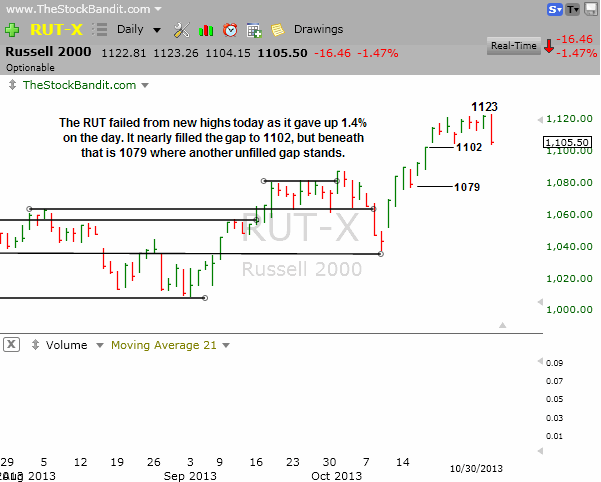
RUT – The RUT has paused a bit lately but today made an incremental new high and then reversed hard. That painted a bearish engulfing bar and now price is near the unfilled gap to 1102 I’ve been discussing for 2 weeks. Beneath that is another unfilled gap to 1079 which we could see if today’s weakness sees any follow through.
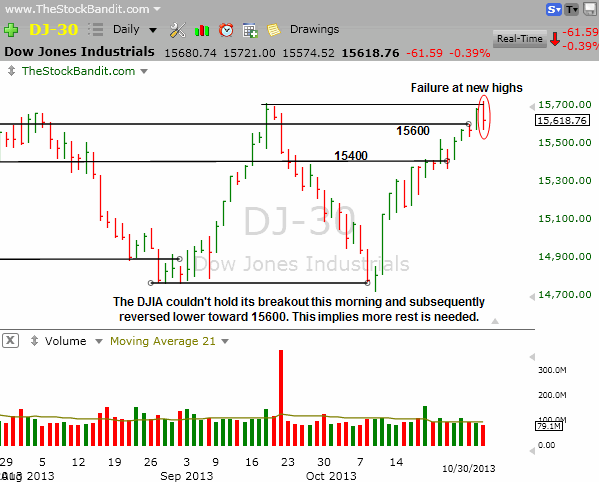
DJIA – The DJIA finally broke out today with an incremental new all-time high by about 12 points. However, it couldn’t hold onto the new-high territory and promptly reversed lower to finish just 18 points from 15600, a key level we’ve seen respected on many occasions going back to the summer. A turn below 15600 would bring 15400 as the next level this index could gravitate toward.
Notable Names:
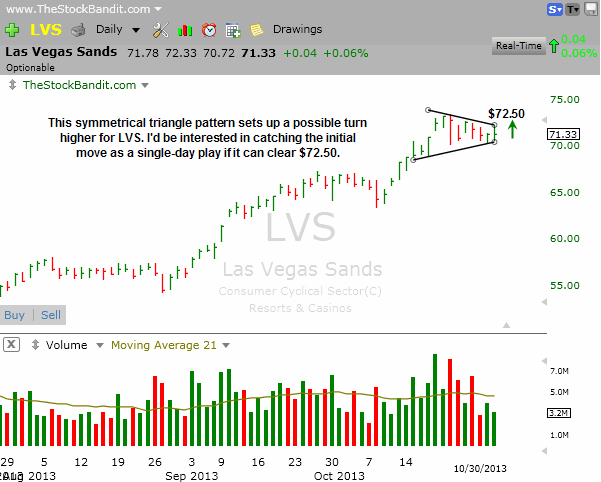
LVS is sitting in a tightening wedge or triangle here after a recent advance. This rest may be nearing completion and this looks tradeable above $72.50 on a turn up through the trend line. This would only be a single-day play for me as the upside volume the past two sessions has been less than impressive.
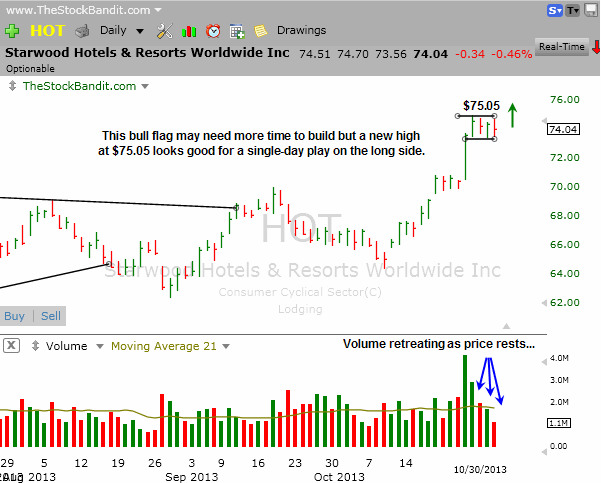
HOT is working on a bull flag here and may need a bit more time. If it clears $75.05 though, it looks good for a single-day play on the long side. I’d prefer to see a slightly larger base (more bars) to consider a swing.
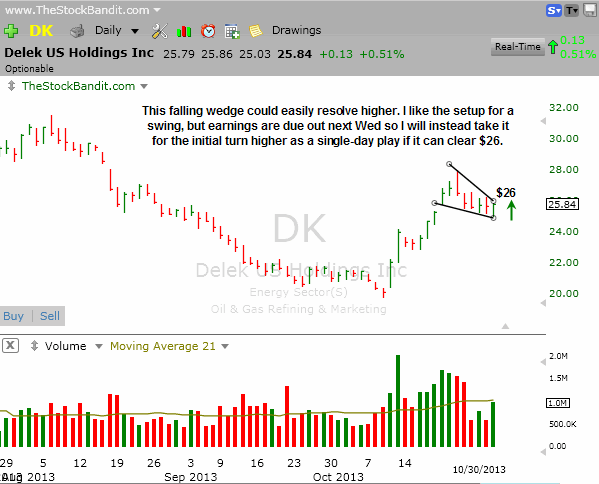
DK is sitting in a falling wedge tonight and a turn up through the trend line at $26 could generate quick interest. Today’s upside volume picked up, which suggests it may be ready, as well as the fact price is near the apex of this wedge. Earnings are due out next Wed, so with only a few days of time I’ll opt for a single-day play here in case it fires.
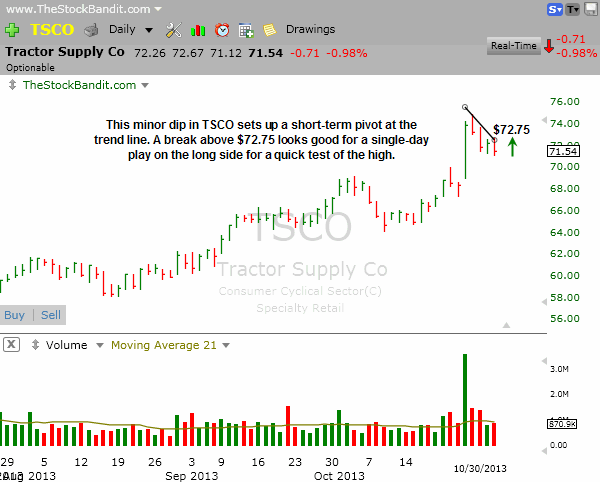
TSCO is in short-term pullback mode here but a turn up through the trend line at $72.75 could produce a quick test of the high near $75. The last pop lasted just 1 day, so that’s all I’m looking for here.
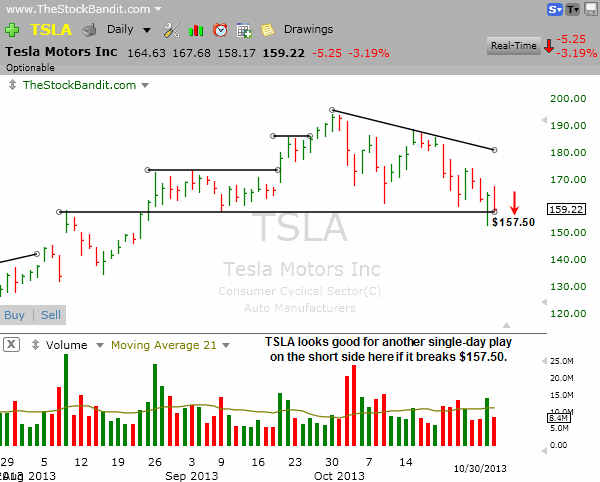
TSLA keeps testing the $158 area as key support and could again provide a quick shorting opportunity here. I like it for a single-day play on the short side if price undercuts $157.50. The low this week was $153, but I suspect that would be broken on another turn lower. This is a very fast mover and therefore just a single-day play for me, plus a swing stop is just not apparent on the daily chart.
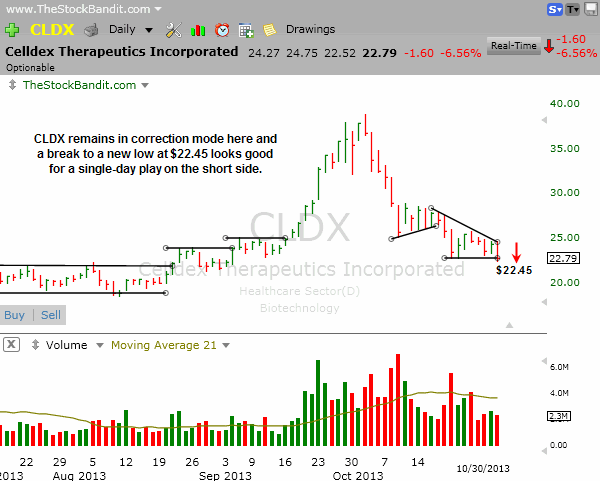
CLDX is resting on support here but a new low at $22.45 could trigger more selling. This stock is becoming a bit oversold and is also approaching some levels from the summer, so I’m only interested in a single-day play here.
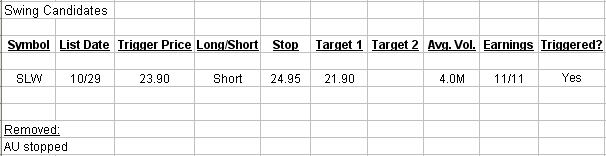
New Swing Trade Candidates:
No new swing candidates tonight to add to the list. Earnings dates are still interfering in some cases and other setups simply need to tighten to reduce the risk associated with them.
Bullish Watch (click for charts)
Bearish Watch (click for charts)
Trade Like A Bandit!
Jeff


