


Good evening StockBandits!
The selloff that hit stocks so hard on Thursday was completely undone on Friday with a snapback rally hard enough to give the bears whiplash. The S&P 500, for example, lost 23.34 on Thursday then rebounded 23.46 on Friday in a mirror-image type of reversal. The other indexes saw similar turnarounds as the downside breaks to the trading ranges were completely negated. Bulls who sold in expectation of a deeper pullback or bears who shorted in hopes of some downside follow through were fooled, and it’s almost as if every single seller reversed that transaction with an offsetting buy on Friday. For the week, only the NAZ lost ground (-2.81 points) while the S&P, RUT and DJIA each posted gains.
Earnings season is starting to wind down, but economic headlines will continue to play a role as traders jump to conclusions about Fed tapering. More important than the news flow of the day though will be the charts, and right now we’re still range-bound for everything but the least-important DJIA. For as long as the range persists, we’ll see back-and-forth indecision, choppy trading, and follow through will be very hard to come by. It’s critical to keep that in mind until we get a directional resolution.
The holidays are approaching and so is the end of the year, which means we’re in the home stretch of trading. If it’s been a great year for you, maintain that and finish strong without allowing that to change. If instead you’ve struggled, aim to start preparing for 2014 by reviewing trades from this year, carefully noting the things you can improve and mistakes you can eliminate but also taking note of the things you did well. Trading requires confidence, so feed what you have and work in such a way that you develop more of it going forward.
In terms of trade setups tonight, I’ve got a pretty limited list. The sharp selloff Thursday and subsequent snapback rally on Friday gave many charts a sloppy look, and my bullish and bearish watchlists were each reduced as a result. There are a handful of names I’m eyeing for Monday though, so let’s get to the charts!
NAZ – The NAZ broke support to fill a gap from October, then lifted big on Friday to finish back inside the range. This makes for sloppy trading in the short term, but continued basing action has now fully digested the October rally, which badly needed to happen. 3966 is the number to watch on the upside, while 3855 is Thursday’s low to keep on the radar. A downside break could bring the next unfilled gap to 3794 into the picture.

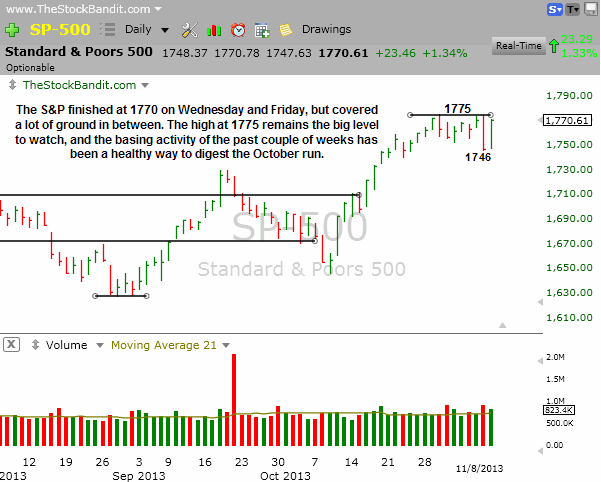
SP500 – The S&P fell apart on Thursday, only to recover the same amount (23 points) on Friday to finish at 1770, Wednesday’s closing level. It’s once again within just a few points of new-high territory, with 1775 being the number to watch on the way up. Beyond that, it’s blue sky for this index, but the bulls will need to give it a nudge to exit this high-level consolidation zone.
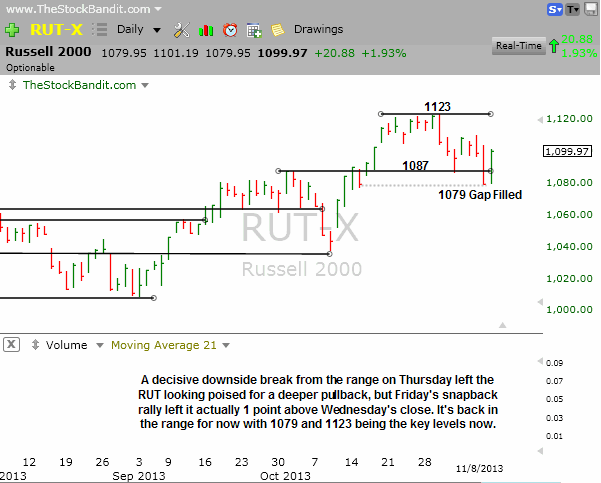
RUT – The RUT looked poised for a much deeper retracement after Thursday’s break of 1087 support and gap fill to 1079 from October to post its 6th decline in 7 sessions. But with Friday’s arrival came a surprise move right back up to finish 1 point above Wednesday’s close of 1098. It’s now back inside the range with room to move higher or lower to some extent before something technically meaningful happens.
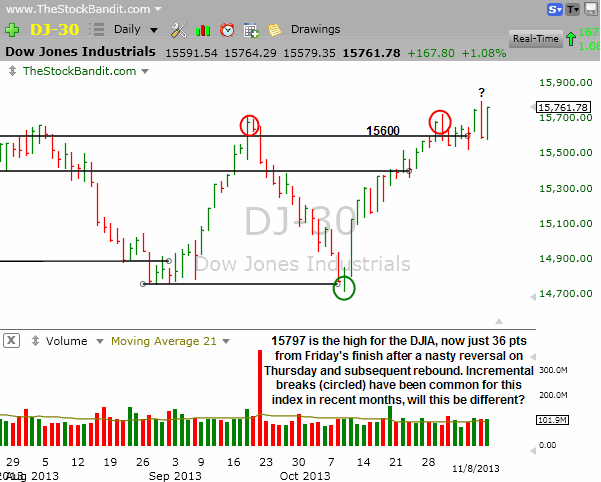
DJIA – The DJIA has tagged 15600 in almost every session for the past 2 weeks. Incremental new highs/lows have plagued this senior index with subsequent reversals, so last Wednesday’s new incremental high looked poised to follow the same playbook when Thursday’s bearish engulfing bar got painted. However, Friday’s rally left this index shy of its intraday high but sitting at a new all-time closing high. The door is open for more upside, but for it to stick in this index we’ll likely need to see some of the others achieve a similar feat (S&P).
Notable Names:
TWTR was all the buzz last week as the hot IPO, but with the FB debacle still so fresh on the minds of traders, the upside was very short-lived. The stock opened for trading Thursday at $45.10, traded up past $50 briefly, then finished Thursday below $45. An attempt at upside on Friday also fell lame, with the stock shedding over 7% to close at $41.65. Anyone itching to buy this stock at $45.10 when it opened is now down more than 7%, and what’s worse is that there is no technical level to watch as support until the offering price at $26. This is exactly why it’s so important to exercise patience and let a stock trade for a little while to carve out some levels of support/resistance so that as a technical trader, there are levels to mind. Any trading prior to then involves arbitrarily picking numbers and hoping for the best, which rarely leads to success.

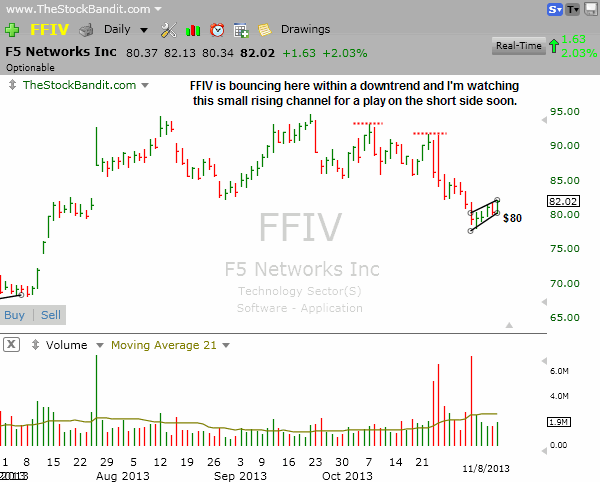
FFIV is a stock that’s on my radar but doesn’t look ready yet for a trade. I think the current bounce has a good shot at carving out another lower high, so once the bounce stalls out or begins to roll over I’ll be looking for a shorting opportunity.
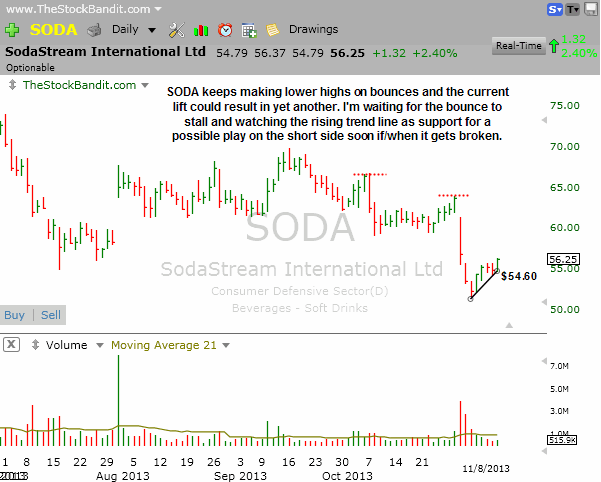
SODA is also on my radar for a play soon on the short side but not just yet. Friday’s strength saw a finish near the high, keeping the current bounce going for now. Once it stalls out, I’ll be looking for an entry below the rising trend line.
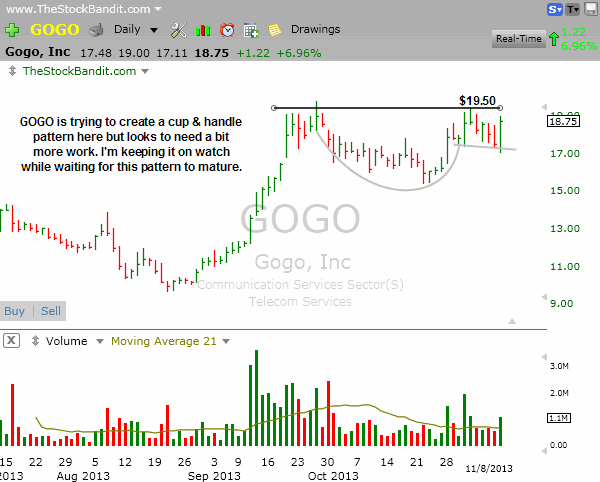
GOGO is working on a cup and handle pattern here, but currently it’s a little bit sloppy. Resistance is around $19.50, but it’s the cup and handle portions of the pattern which aren’t as clean as they could be. This one’s on my radar for now as I’d like to see either the handle tighten up or see price get a bit closer to resistance.
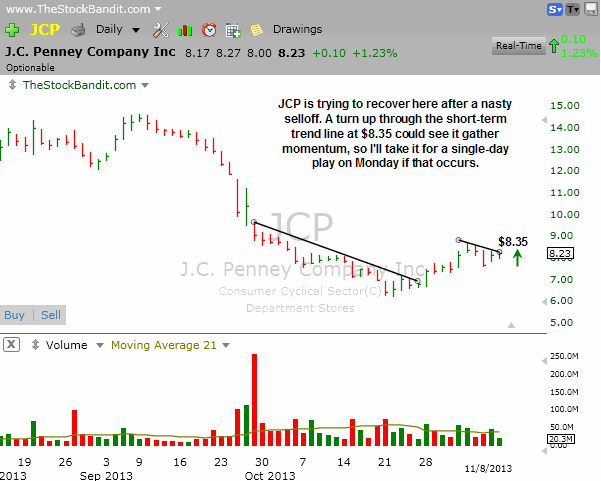
JCP looks ready for another leg up here, but even at $8 it’s a highly volatile stock. A push through the trend line at $8.35 looks good for a single-day play on the long side, but given all the weakness this stock has endured I just am not interested in keeping it overnight.
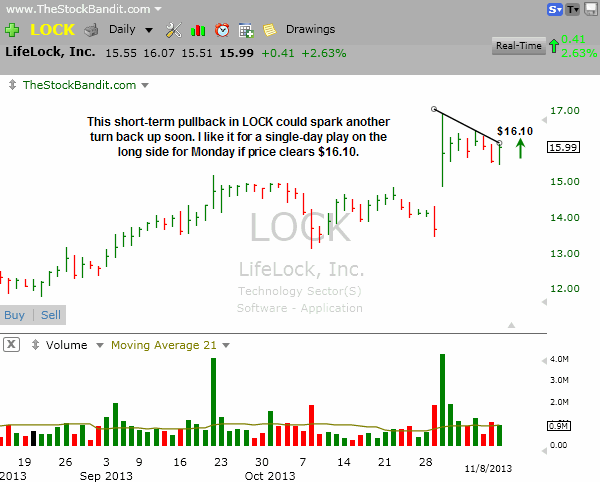
LOCK is trying to turn back up here after a pullback and a trend line break at $16.10 could produce a quick spike higher. I like it for a single-day play on the long side for Monday if price can clear that level.
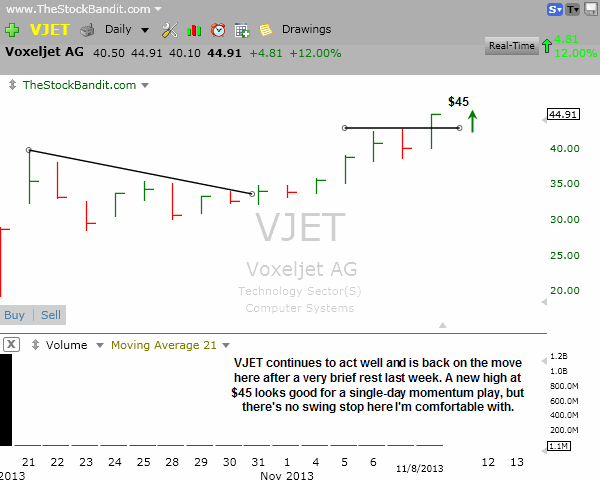
VJET is running with momentum but doesn’t look extended yet. This is another new issue with only a few weeks of history, but a new high at $45 looks good for a single-day play on the long side to participate in some short-term continuation.
New Swing Trade Candidates:
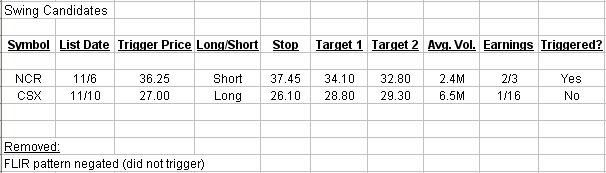
These stocks look ready for imminent multi-day moves. Pattern confirmation occurs with a move through the entry level. Initial stop and target levels are also provided.
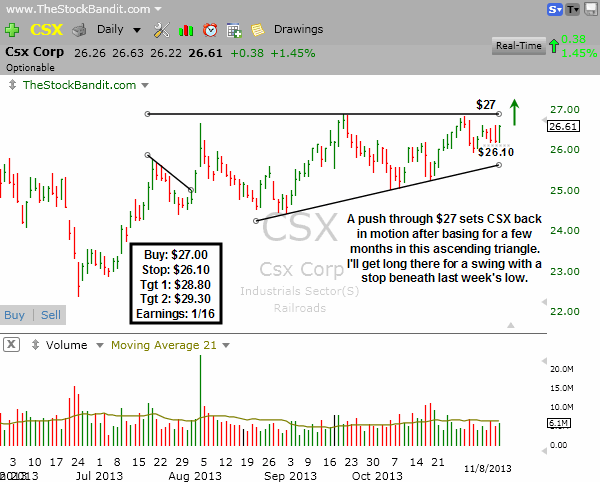
CSX has been basing for months to build this ascending triangle pattern, and a push through $27 will trigger a buy for me as a swing. I’ll have a stop in case of a downside reversal just beneath last week’s low, and on the target side will be looking for an eventual push past $29 by projecting the height of the pattern beyond the breakout zone. Earnings have already been reported for the most recent quarter so the next announcement isn’t until Jan. 16. This one may need a little more time, but with the improved volume Friday and strong finish I wanted to go ahead and set it up.
Bullish Watch (click for charts)
Bearish Watch (click for charts)
Trade Like A Bandit!
Jeff


