


Good evening StockBandits!
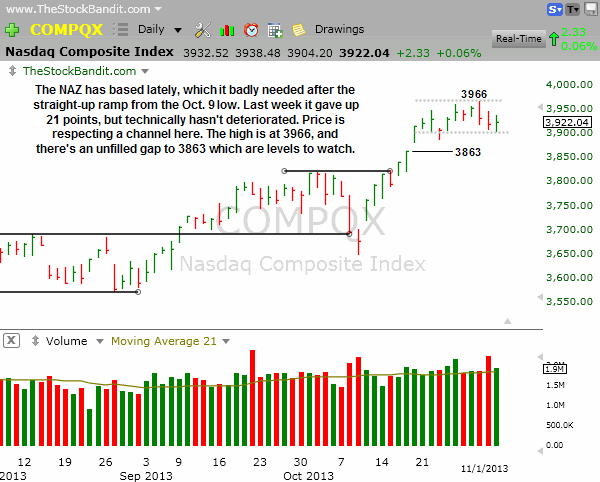
November arrived on Friday, and we saw the usual first-of-the-month strength in the big 3 indexes. Morning weakness was bought, taking the S&P 500, NAZ and DJIA all into the green to start the 11th month. For the week, the NAZ gave up 21 points, the RUT shed 23, while the S&P added 2 and the DJIA gained 45. We saw new all-time highs established on Wednesday for the RUT, S&P 500 and DJIA, but the excitement fizzled from there.
Curiously, the RUT is showing some relative weakness in recent days, including last week as it gave up 2% right off the intraday all-time high on Wednesday. Last week we saw a glaring divergence there as speculative small-cap names came under some pressure for the first time since early October. The uptrend there is very much intact, but we’ll need to keep a close eye on whether or not the weakness persists, as that may suggest a waning appetite for risk.
So it’s still a bit of a two-sided market here, with the blue-chip S&P 500 and DJIA each holding up well while the RUT and NAZ put in some much-needed rest. We have the highs to keep on watch, as well as some unfilled gaps a short distance below current levels, which gives us a starting point for the week in terms of levels to keep front and center.
In terms of individual names, I was pleased to see some much higher quality bases this weekend on the daily charts. With more and more companies having reported earnings for the most recent quarter, it frees up more names in terms of scheduled news. Paired with some better patterns which have built in recent days, I’ve got a handful of new swing candidates heading into the week. I’ll add more as they emerge, but there have been so few lately that it’s just nice to have more candidates for a different timeframe than the single-day plays which have been so prevalent lately.
Let’s get to the charts.
NAZ – The NAZ is carving out a bit of a channel here as it respects the high as well as the closing low of the last couple of weeks. This lateral price action can of course make for some choppy days, but it’s been long overdue and it’s finally here, allowing more individual names to base as well.
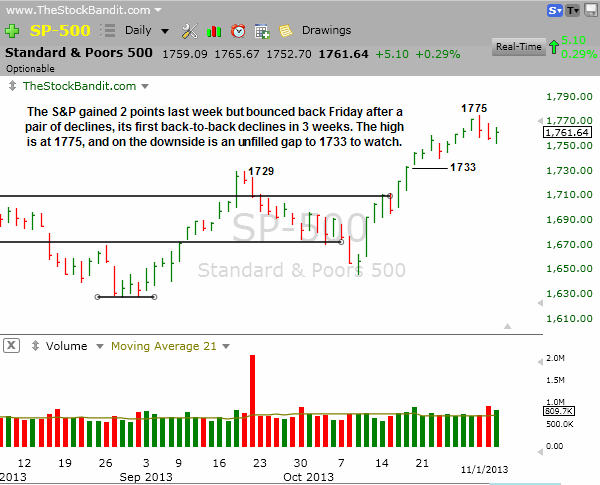
SP500 – The S&P saw a minor retreat off its high from Wednesday, but overall this index remains very strong and technically in great shape. Should some selling kick in, there’s an unfilled gap to 1733. Otherwise, the current high at 1775 is the level to watch on the upside.
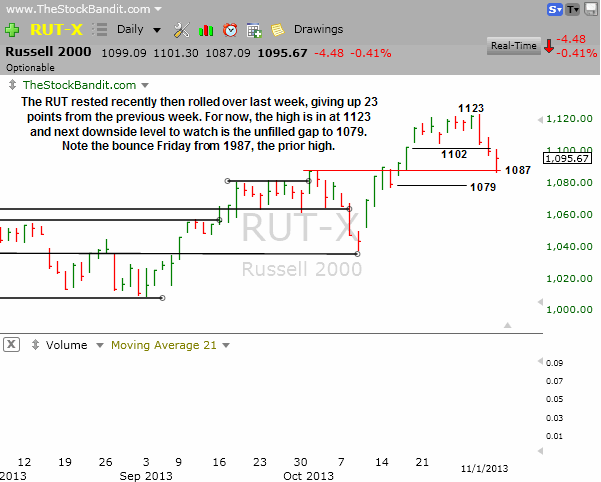
RUT – The RUT saw a hard selloff after setting an incremental new high on Wednesday at 1123. It pulled back all the way to 1087 on Friday before bouncing from the same level it peaked at back on Oct 1. Should 1087 happen to get broken, there’s an unfilled gap down to 1079. The last 3-day dip in this index was in early October and led to a giant rally. Traders won’t quickly forget that as we look at the current dip. Those calling for a top will want to see a bounce fail somewhere beneath 1123.
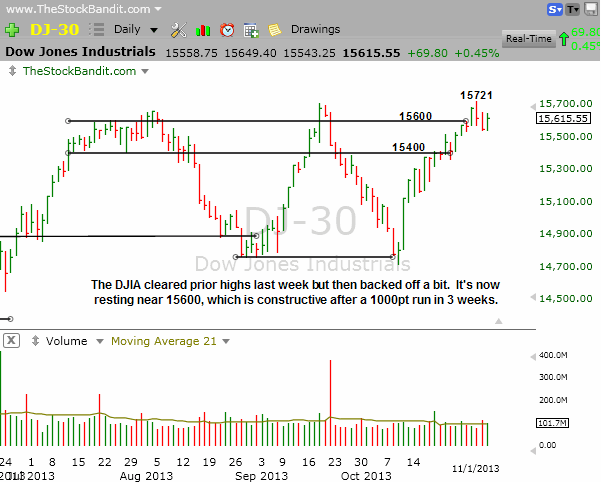
DJIA – The DJIA made an incremental new all-time high on Wednesday, then pulled back and is now hovering near 15600 – a level it has respected on numerous occasions in recent months. Having just run over 1000 points higher from the October 9th low, this index is entitled to a rest. Bulls just won’t want to see it spend too much time beneath the highs or talk could soon surface of a double-top. Interestingly, the prior high from September was also an incremental breakout which promptly failed, so we’ll see if the breakout last week has a different fate.
Notable Names:
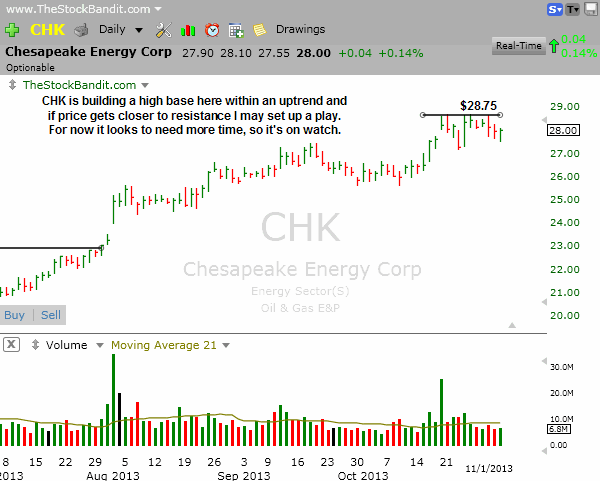
CHK is on watch for me here as price churns and coils beneath short-term resistance. I’d like to see price start to pressure resistance and then set up a play, but wanted to bring this one to your attention as this high base builds.
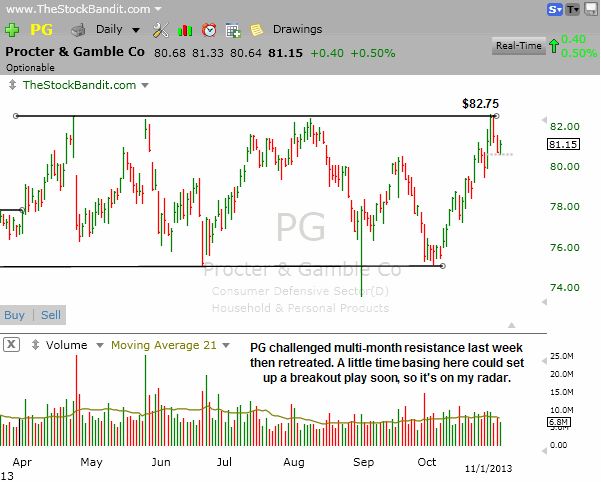
PG is also on my radar after having tested key resistance yet again last week. Any time spent beneath the highs but at the upper end of the range would bode well for this stock, so I’d prefer to see it move laterally for a few days and then start to curl back up. For now, it’s on watch and doesn’t yet look ready.
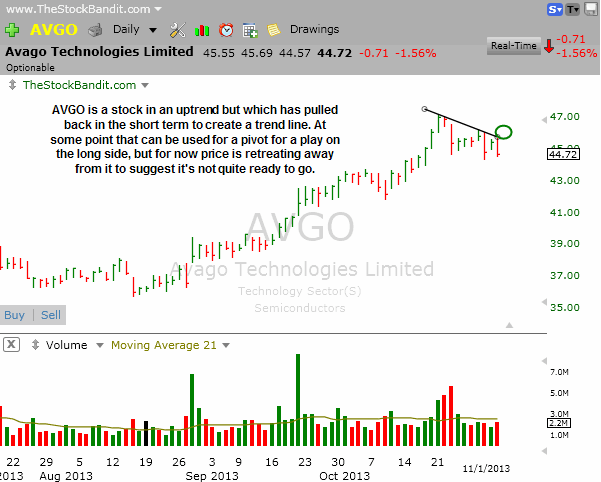
AVGO turned lower on Friday after another test of the short-term descending trend line. This one seems to need a little more time, so I’ll keep it on watch for now. The overall trend is still up though, so it could soon present a play.
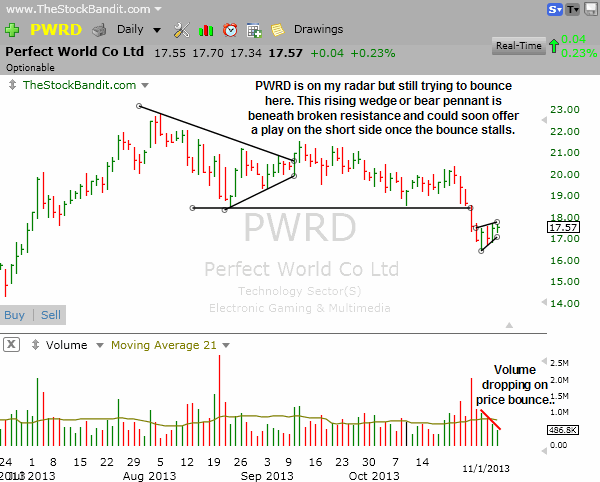
PWRD is a bearish setup that’s building as price recently broke major support, continued lower, and has since rebounded back in a lazy fashion. I’m watching this bearish rising wedge or bear pennant (if the prior decline is included), as any stall-out in price and minor weakness could produce a shortable setup. I’m keeping it on watch for now.
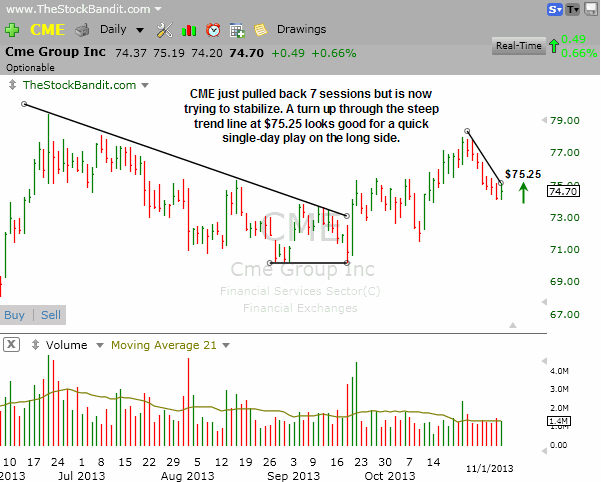
CME may have just completed a short-term pullback and a turn up through the trend line at $75.25 looks good for a single-day play on the long side. This stock has been rather indecisive in recent weeks, which is why I’d prefer to take it for only the initial turn up through the trend line should it happen on Monday.
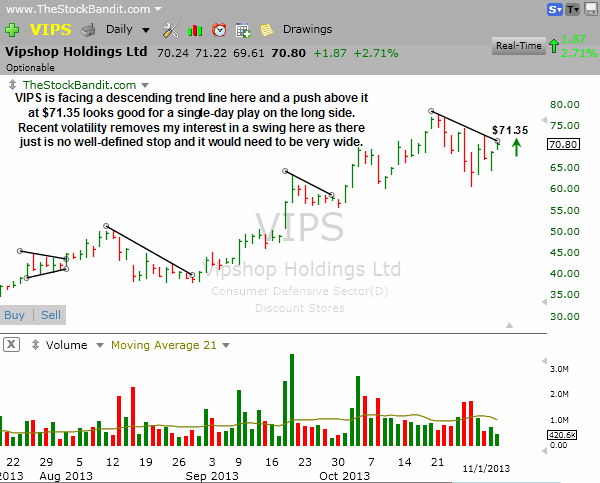
VIPS is getting a bit more volatile the past few weeks but still could produce a pop if price can clear the trend line at $71.35 on Monday. Due to the way it’s been moving, I’m not interested in holding it overnight.
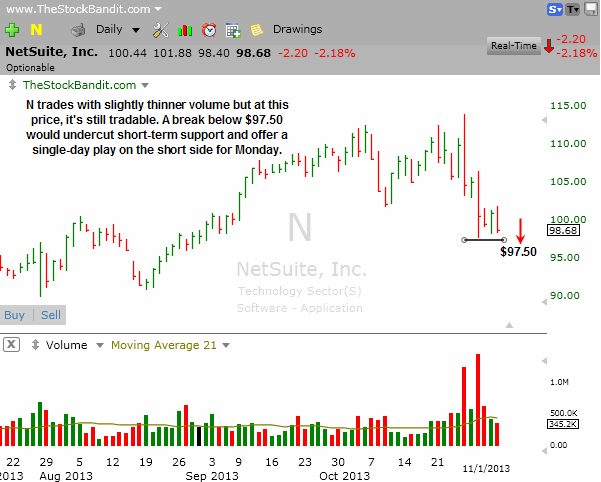
N has been weakening lately and a break to a new low at $97.50 could spark more short-term selling. This base needs more work before I’d consider it for a swing, but as a single-day play this could have some opportunity on the short side for Monday.
New Swing Trade Candidates:
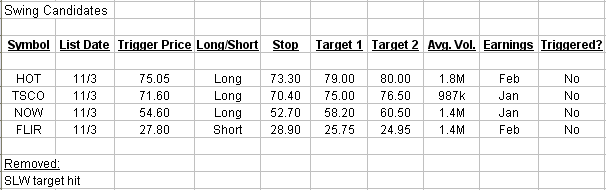
These stocks look ready for imminent multi-day moves. Pattern confirmation occurs with a move through the entry level. Initial stop and target levels are also provided.
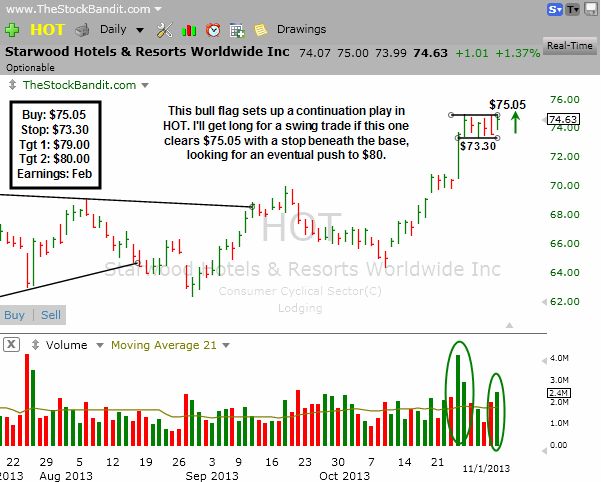
HOT was listed last week here as a single-day play, but I noted then that if the base could mature I’d consider it for a swing. That has happened and this bull flag looks very good. Price turned up toward resistance on Friday with expanding volume, so I’m now looking to get long on a breakout through $75.05 for a swing.
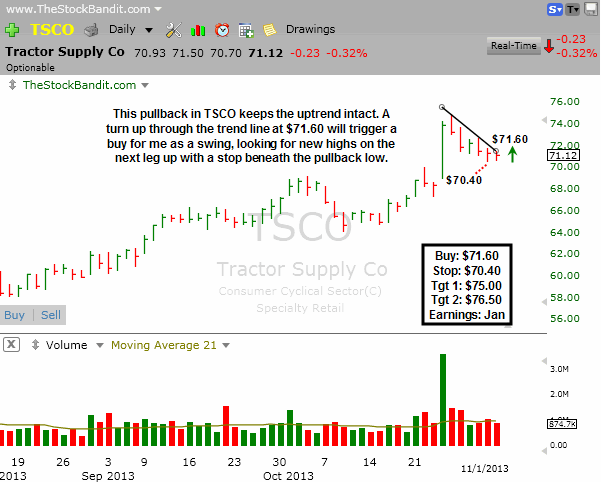
TSCO has pulled back but only given back a portion of its post-earnings pop. A turn up through the trend line at $71.60 will trigger a buy for me as a swing with the start of a new leg higher within the uptrend.
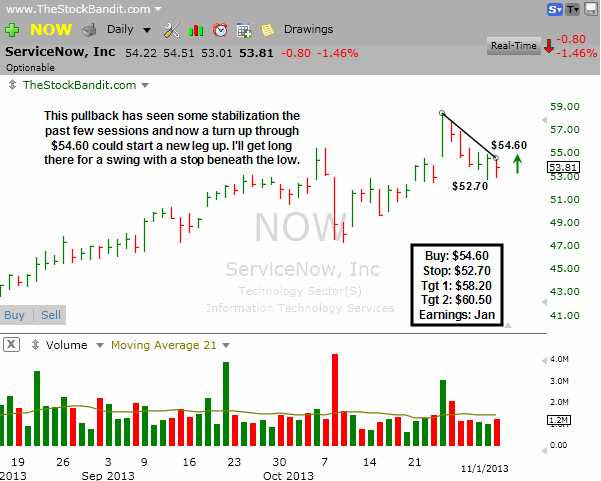
NOW has also pulled back from its recent high but held support. A turn up through the trend line at $54.60 will trigger a buy for me as a swing. Like the others listed above, I’ll have a protective stop beneath the pullback low and will be looking for a decisive move higher if price turns back up.
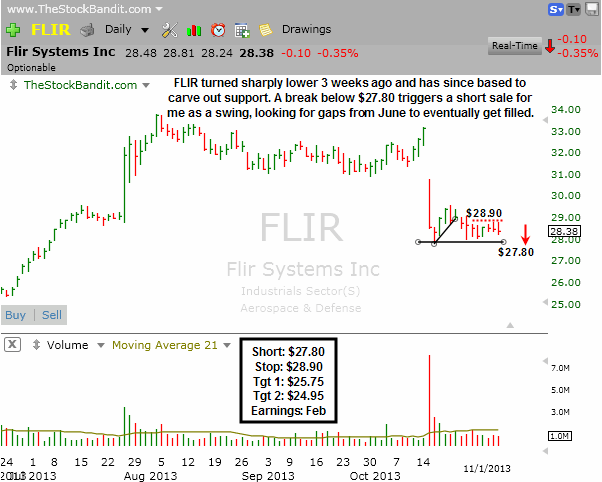
FLIR may need a little more time but I’m setting up this swing candidate now just in case. It broke down hard a few weeks ago, failed the next bounce, and now is hovering just above support. A break below $27.80 will trigger a short sale for me as more selling kicks in to continue the correction phase. There are a couple of unfilled gaps from June I’ll be using as targets.
Bullish Watch (click for charts)
Bearish Watch (click for charts)
Trade Like A Bandit!
Jeff


