


Good evening StockBandits!
The warning signs were there, and today we got another pullback. The shift to safety (gold & bonds) and intraday equity weakness on Tuesday, paired with a lack of follow through to Friday’s big rally, set the stage for some selling if the bulls didn’t get in gear. Last night I discussed the threat of lower highs, as well as “the look of fatigue…ample room for a pullback” for the NAZ. I also mentioned that “any early strength which gets sold could quickly see an acceleration in profit-taking” and that’s exactly what occurred today as a modestly positive start lasted only a few minutes before a trend day set in to the downside with weakness throughout the session.
Tonight, we have a lower high confirmed for the RUT (with the lower low coming upon the break of 1111 today), the S&P has turned decisively away from resistance, the NAZ just made a lower low, and the DJIA is quickly approaching its early December pullback low. Those are definite negative changes of character, although only time will tell just what they translate into. For now, caution should be elevated with new buys as the bulls seem to be stepping off the gas a bit here.
It’s been a big year for the buy-and-hope crowd, and there’s a sense of urgency here to lock in gains as 2013 draws to a close. Right around the corner are a FOMC meeting (next week), thin holiday trading volumes, index rebalancing, fund redemptions, tax-related selling, and window-dressing. Those cross-currents could keep things tricky as the month wears on, so it’s certainly not a time to throw caution to the wind. Stocks have been strong, but a short-term pullback seems to be setting in here and shouldn’t be dismissed.
**One other note tonight is that I’ll be putting out tomorrow’s Charts on Demand video earlier than normal, so if there are a couple of tickers you’d like to see me cover, hit reply to this email and send them my way.
Let’s get to the charts.
NAZ – The NAZ broke the pullback low from last week of 4004 with a move to 3998 today. It did just make a higher high, but this points to indecisive price action for now and suggests the recent dip buyers are feeling some remorse. 3966 is the next level to watch for this index, which was lateral resistance in both October and November.

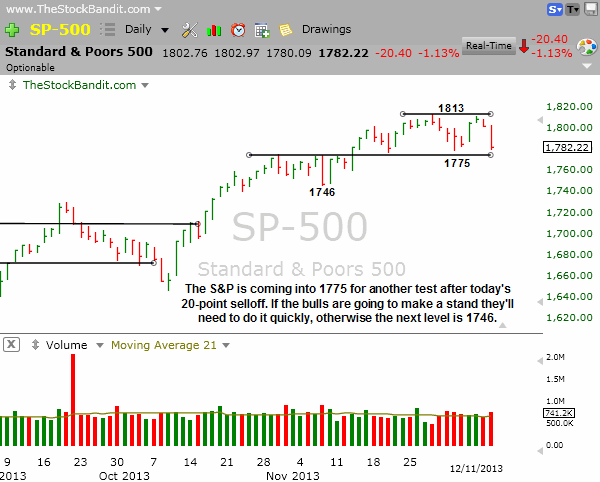
SP500 – The S&P hesitated at resistance the last couple of sessions then turned sharply lower today with a decisive decline. That took it to within just 7 points of 1775 by tonight’s closing bell, leaving it vulnerable to a downside break of this trading range if the bulls don’t step up soon. A breakdown there and 1746 is the next level to watch on the downside.
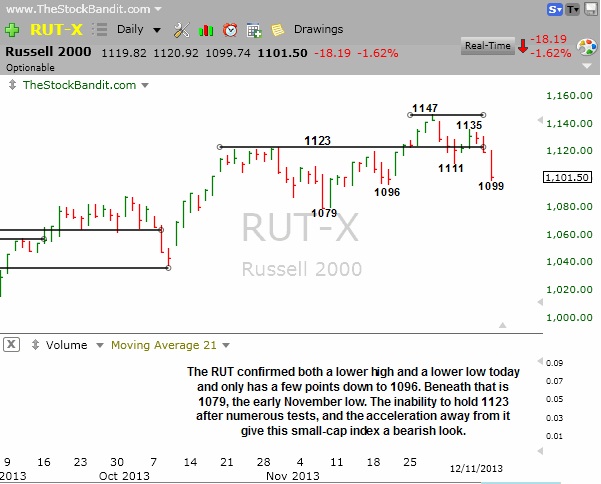
RUT – The RUT just carved out both a lower high and a lower low, putting it in correction mode for now. Today’s selloff was decisive, leaving it just a few points above 1096. Beneath that level is 1079 as next downside support. To see the more speculative small-caps get sold this aggressively points to a big decrease in the appetite for risk right now.
DJIA – The DJIA broke its uptrend channel last week then saw a big bounce Friday. That lift saw no real follow through, and has now been almost completely erased. 15791 is the last pullback low, which is just 52 points from tonight’s close after the hard selloff we saw today on increased volume. All signs here point to a negative change of character still underway.

Notable Names:
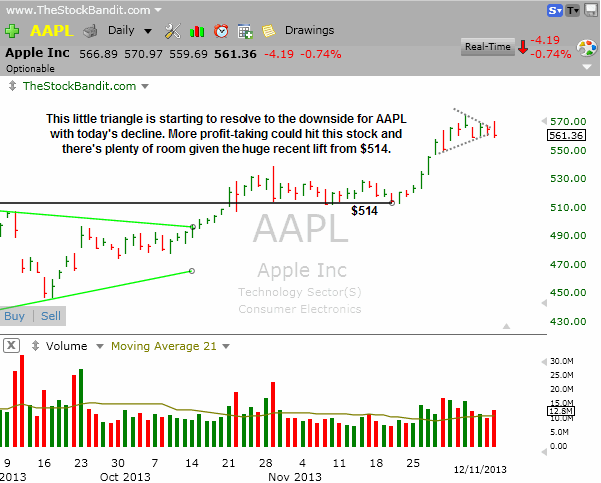
AAPL tried to resolve this little triangle higher today, but couldn’t hold it and instead reversed lower. This has implications for the NAZ, and there’s plenty of room for a deeper retreat in this stock after a $61 bounce from support.
JCP is still struggling after the hard break of rising support last week. Price has bounced only slightly and now is trying to turn lower again. Note the light upside volume on the bounce, which showed little conviction on the part of buyers. I don’t short $8 stocks, but this one looks vulnerable to a deeper pullback as it tries to turn the corner from a very deep correction this year.

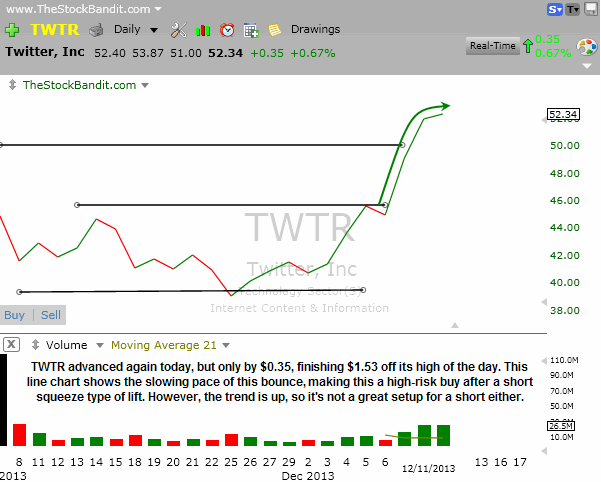
TWTR again showed relative strength today, posting another gain despite a very weak market. However, the pace of the bounce is slowing here and price finished well off its high of the day. I’ve changed this chart to a line chart to show that price is trying to move laterally here. There’s plenty of room for some profit-taking after this big run, but with so much strength stepping out on the short side could be very painful. This is what I would call an “avoid” setup as I just don’t want to chase strength or fade an all-time high.
CZR is trying to stabilize here after a pullback and now has a shot to break above this descending channel. A push through $19.85 looks good for a single-day play on the long side with room back toward the $21 area. This one has the capacity to move quickly, but the risk/reward for a swing just isn’t compelling to me.
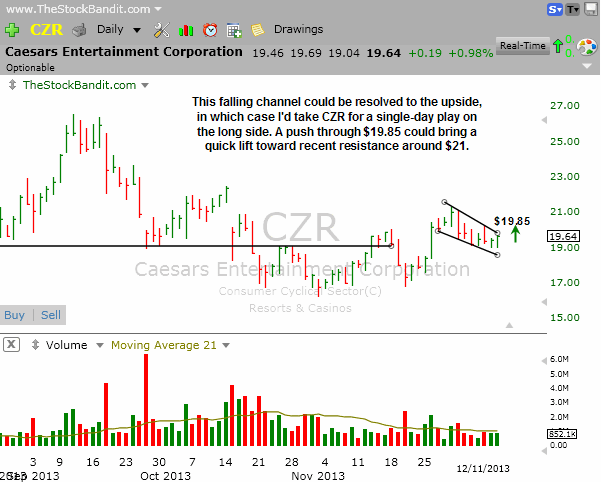
SLB was listed here last night for a play today but it broke the $86 level in the final hour of trading. For a single-day play, that’s too late in the day for me as it simply doesn’t have much time to work. So, I’ll set up another play here for tomorrow as there’s still some downside potential, this time using $85.80 as a trigger. Again, this will be a single-day play as a swing stop isn’t much closer than the August congestion zone, making this a risk/reward that simply isn’t very favorable. As such, participating in the initial breakdown with a tighter intraday stop (1%) has more appeal.
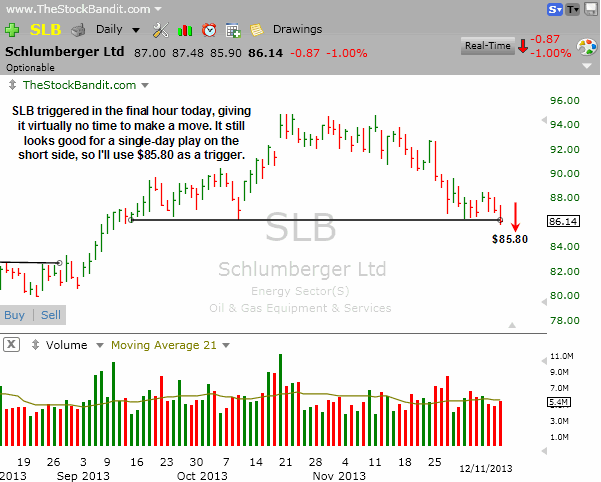
GME is still looking weak here and is resting just above short-term support. I like this best for a single-day play below $44.70, as price has undergone a significant correction in recent weeks without a bounce. I believe that will eventually come, but by taking a single-day timeframe for a short sale I can still participate in a break should it occur.
QIHU has been on my radar for a few weeks as this large head and shoulders pattern builds. I’ve been hoping price could base before breaking the neckline to carve out a tighter swing stop, but that simply hasn’t happened. A break could come any day, so if it happens here I’ll just take it for a single-day play on the short side upon a break below $78. Currently, a swing stop would belong north of $86, which is simply too wide. If it doesn’t break the neckline and can base quietly for a few days, I may reconsider, but in its current state it’s a single-day setup for me.

XEC is resting on support after making some short-term lower highs on recent bounces. A break below $93.90 could easily spark another round of selling, although downside moves in this stock haven’t lasted long before bounces set in. As such, I’ll take it for a single-day play in order to participate in the initial move lower if a break occurs.

New Swing Trade Candidates:
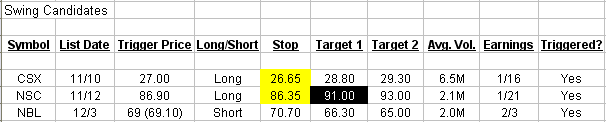
No new swing candidates tonight. Setups are currently only trustworthy for abbreviated timeframes and need more time to further develop. That will mean better risk/reward scenarios than what’s currently available, so I’m sticking with my existing positions heading into tomorrow’s session.
Bullish Watch (click for charts)
Bearish Watch (click for charts)
Trade Like A Bandit!
Jeff


