


Good evening StockBandits!
The DJIA was up about 22 points prior to the FOMC announcement today, but each of the other averages were slightly in the red. It was indeed a market on hold for the week’s main event, and ultimately the response to it did not disappoint in terms of magnitude. The knee-jerk reaction was a downside spike, but it only lasted a few moments before strong bids kicked in for the remainder of the session. In the end, we saw 1.1% to 1.8% gains across the board.
Today’s move leaves the indexes once more looking very strong after wide-ranging bars, some tests of support zones, and finishing at the highs. It was an erratic day. The DJIA, for example, got to within 1 point of the November all-time high with a lift of some 360 points off the session low. The S&P 500 undercut 1775 support, then reversed enough to end the day within 3 points of its all-time high. The NAZ nearly covered its entire range as well with a multi-week low only to rally back and post its highest close since 2000.
In working the charts tonight, the biggest issue I ran across was sloppy patterns after today’s wide-ranging bars were painted. The big question on the minds of traders is whether or not we can rely on additional strength, and only time will tell us that answer. I will say that breakouts, although close by in several of the averages, have yet to occur. Additionally, it’s now officially late December and thus prime time for the cross-currents I’ve been discussing all month to kick in. That and the lighter holiday volume we’ll see in the days ahead are likely to keep things tricky, so I’m not particularly interested in pressing my bets here. A night to digest the news of the day could bring a different tape tomorrow, or we could see aggressive follow through. My game plan is based on the charts, and tonight there just aren’t a lot to choose from unless I’m willing to designate some very wide stops, which simply isn’t my style.
Tomorrow I’ll have the weekly Charts on Demand video where I review your stocks by video. If there are a couple of tickers you’re interested in seeing covered, hit reply to this email and send them my way so I can add them to the list.
Let’s get to the charts.
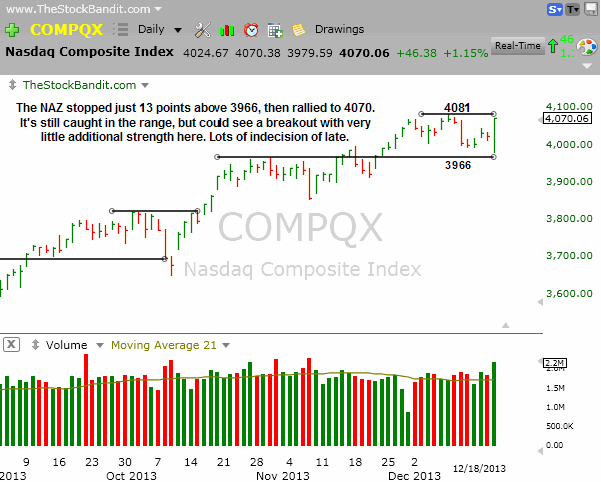
NAZ – The NAZ made a new pullback low today but still held above 3966 to stay within the recent range. From there, it ripped higher by some 91 points to finish at a new multi-year high on a closing basis. It’s 11 points from the intraday high of 4081, so a breakout could happen soon. Lasting moves have not been the routine of this index since mid-October.
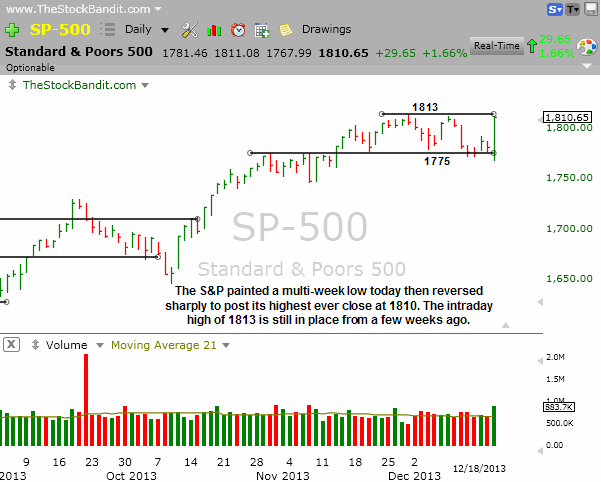
SP500 – The S&P tested both ends of its range today with a move down through 1775 before a quick recovery to 1810 by the closing bell. This index also hasn’t seen lasting follow through since October, so we’ll see if it’s ready to change that.
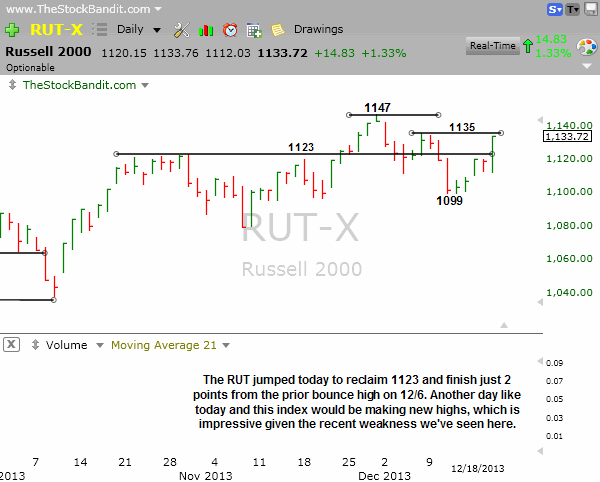
RUT – The RUT saw a big rally from the session low as well, but finished beneath the prior bounce high of 1135 as well as the all-time high from November of 1147. That leaves some work to be done in the small caps if they’re to reclaim the leadership role.
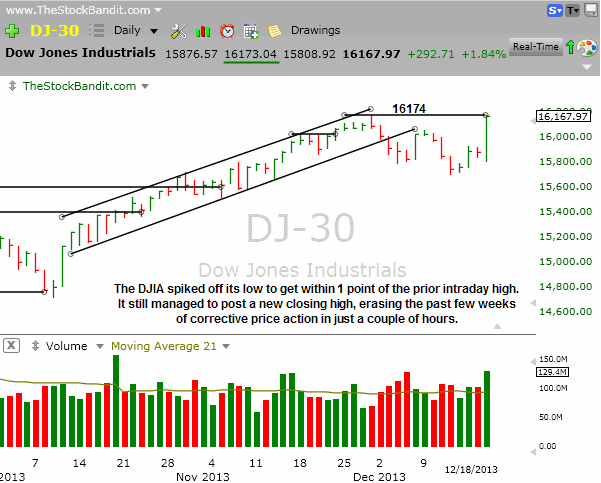
DJIA – The DJIA vaulted higher from its post-FOMC dip to finish at a new closing high. The intraday high of 16174 was challenged but not cleared. This index now has a chance to exit this high-level range it has spent several weeks in, but the bulls are most excited about one day erasing a few weeks of modest downside.
Notable Names:
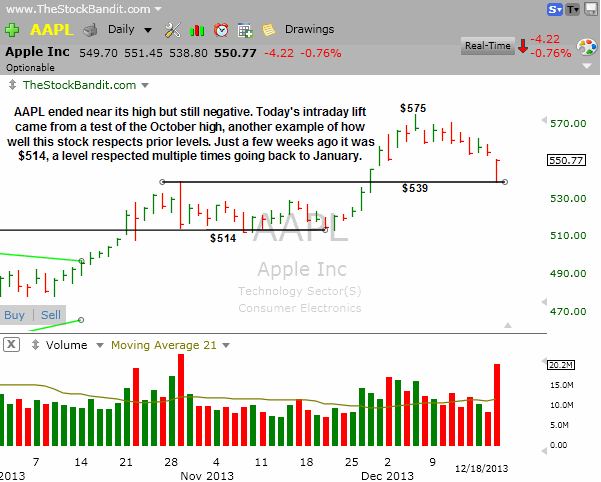
AAPL just keeps respecting prior levels. I’ve noted the $514 level here many times of late and we saw it hold for a few weeks before a lift to $575 kicked in. Then the action cooled off and I noted last week how the downside resolution of a wedge could bring profit-taking. Today price got within $0.50 of the October high, then rallied roughly $12. This is one stock where it definitely pays to keep lateral levels drawn.
TSLA is resting on rising support tonight and could see a quick pullback if it breaks it. I’m not looking to trade it, but instead wanted to point out the relative weakness in this name today after such a big recent rally. Just goes to show that even in a strong market there will be weak stocks, so it never hurts to consider trades in both directions even if there’s an overall directional bias.

DDD looks ripe for a pop here but it needs to clear short-term resistance first. I like it for a long above $82.75, which could bring at least a test of the high ($84.85), if not a new high. This has been a fickle stock in recent weeks, so I’m only interested in the initial move here as a single-day play.

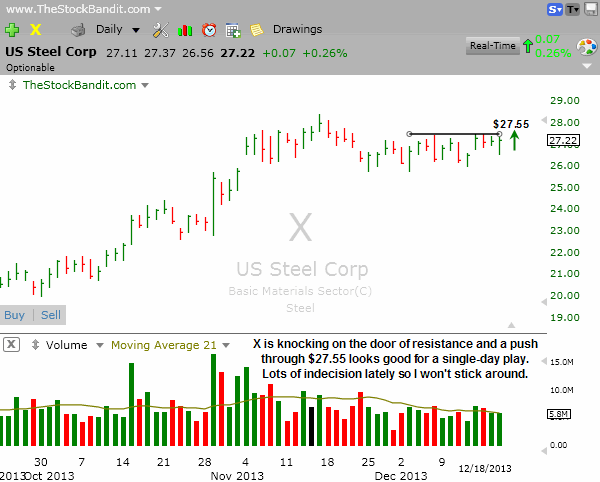
X has been choppy for several weeks but now is facing lateral resistance. A push through $27.55 could produce a quick pop here as price heads back to or possibly through the high ($28.41). Here again, lasting moves have not been the routine of late so I’m only looking to participate in the initial move as a single-day play if this one goes.
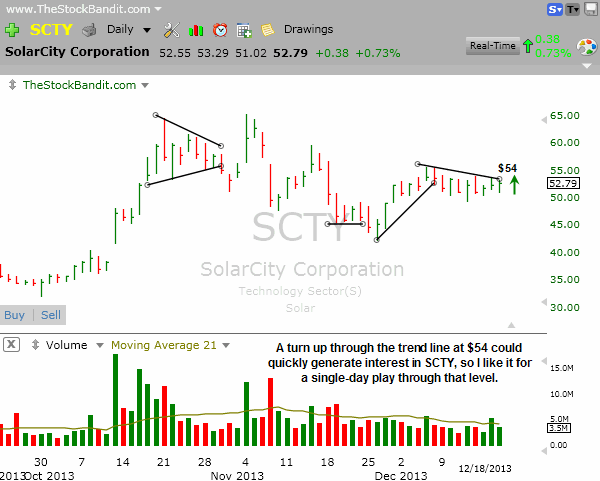
SCTY is knocking on the door here as it challenges a short-term descending trend line. A push through $54 looks good for a single-day play on the long side as price clears the hurdle. A swing stop on this would be rather wide, and I’m just not impressed enough with this setup to take it for a multi-day move.
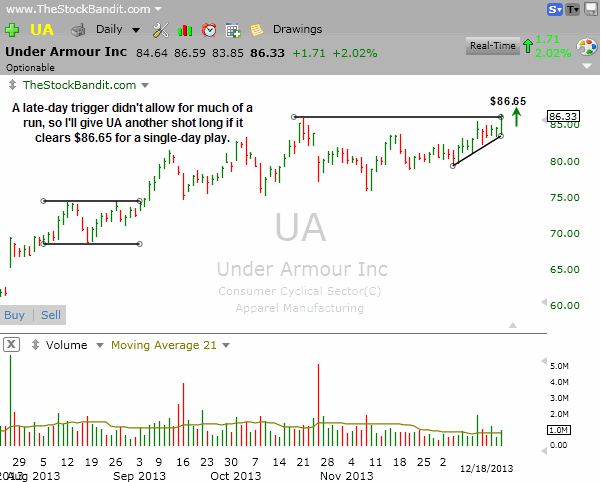
UA was listed here last night and triggered today but in the final hour of the session. That didn’t leave much time to make a move, but I’m willing to give it another shot if it can exhibit some follow through with a new high at $86.65. Here again, this will be a single-day play due to all the recent indecision and lack of lasting moves over the past few months.
New Swing Trade Candidates:
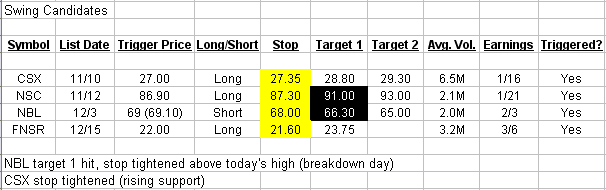
No new swing candidates tonight. Many charts are simply too sloppy to initiate swings here, while others which look set for moves have been too indecisive to expect lasting follow through. I’ve adjusted a couple of stops tonight and booked some profits today, and below is the list of what I’m carrying into tomorrow’s session. As more setups come available, I’ll certainly share them here, it’s just not a time to force trades when great setups aren’t available.
Bullish Watch (click for charts)
Bearish Watch (click for charts)
Trade Like A Bandit!
Jeff


