


Good evening StockBandits!
The averages took a hit to kick off last week, but true to form, the bulls stepped up before it was all said and done. Short-term trading ranges near the highs were held until Friday when a gap up and an early burst of buying took each of the averages to new recovery highs. Overall, the net gains for the week were rather light, but the bulls continue to hold their ground despite concerns that this rally has grown long in the tooth.
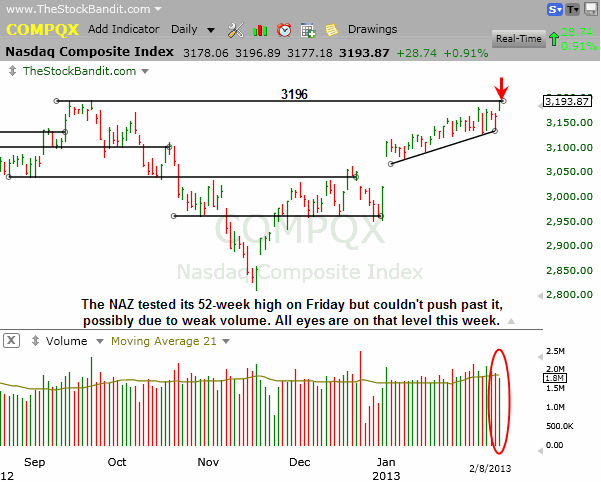
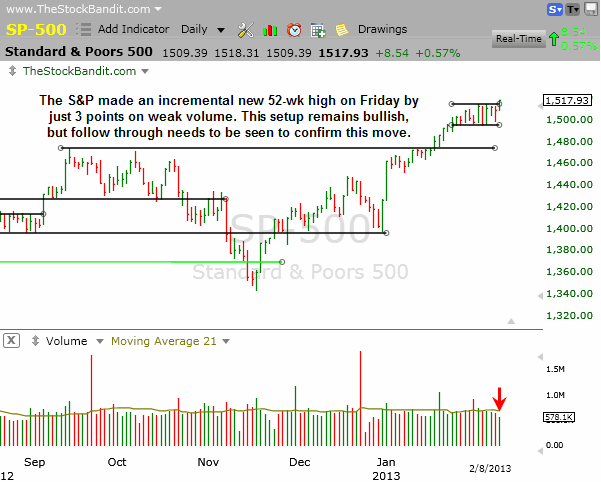
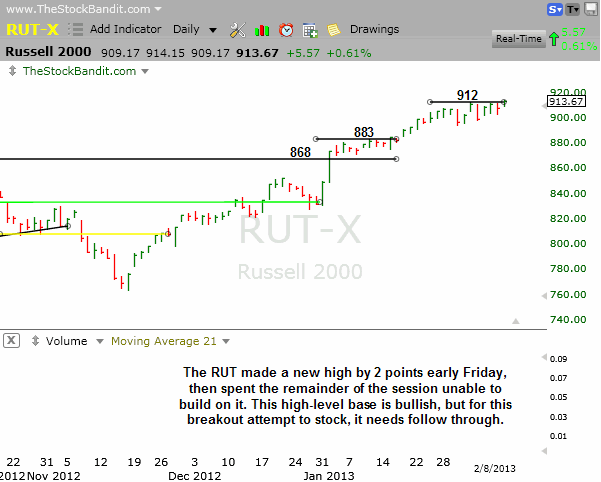
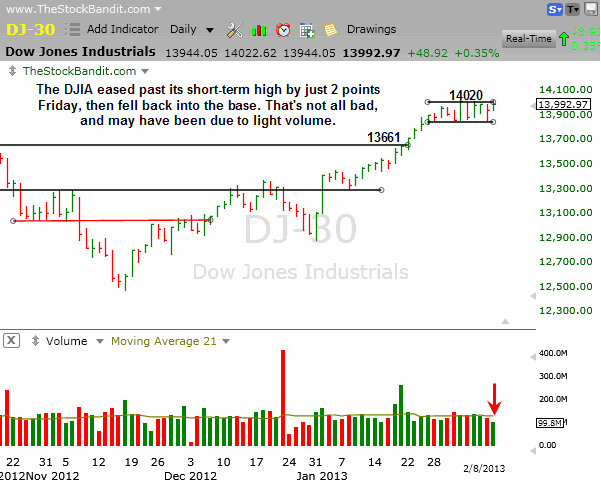
Friday’s action in particular was quite curious. We saw the NAZ tag its 52-week high from September right on the nose, but unable to push past that 3196 level. Meanwhile, the DJIA and RUT each made a new 52-week high by 2 points, and the S&P made a new high by just 3 points. Among the big 3 averages, each of the rallies saw early strength with no follow through, making for multi-hour channels on the intraday charts by the end of the week. In addition, the day’s gains occurred on light volume in every case, which doesn’t indicate widespread participation and also leaves the validity of these new highs somewhat in question.
Technically, the market is still acting pretty well, although we’re just starting to see the emergence of some activity that’s worth noting. We’ve seen a little added volatility of late, and an absence of heavy upside volume. Whether those are precursors to a meaningful pullback remains to be seen, but we’ll watch the action closely in the days ahead to see what clues we can gain. The trend is still up, and until that changes, the long side is still the one to favor. It’s also where the bulk of the setups are, so contrarians should wait for a bigger change of character before looking to fade this rally.
I’m only adding a couple of new plays tonight due to (1) a lack of setups which look ripe for imminent moves, (2) the lack of conviction with Friday’s breakout, and (3) my current exposure is sufficient and therefore I have no need to press.
Let’s get to the charts.
NAZ – The NAZ gapped up Friday then pushed just enough more to tag its 52-week high to the number. From there though, the buyers played the waiting game rather than pressing their edge, creating a 6-hour trading range to finish out the week. The light volume which accompanied the test of the high apparently just couldn’t fuel a breakout, but come Monday the bulls will have another shot. This is the final index of the 4 I watch closest to not yet achieve a 52-week high on its recovery since November.
SP500 – The S&P just eased past its short-term resistance at 1515, clearing that level by only 3 points before the high of the session was in on Friday. Here this index sits in great shape, but follow through would overshadow Friday’s lack of enthusiasm on a new multi-year high. Again, volume was an issue and not the way bulls want to see a new high established.
RUT – The RUT had been testing 912 on Friday but then put a toe across that level to test the waters. Although it didn’t get bitten off, neither did the buyers jump in with both feet. Instead, an incremental new high was made for this index which has tacked on some 20% since mid-November.
DJIA – The DJIA surpassed the short-term high by just 2 points on Friday before falling right back into the short-term range. This remains a very bullish setup, although follow through on breakout attempts like Friday’s will be important to see. All-time highs are now just 206 pts. away.
Notable Names:
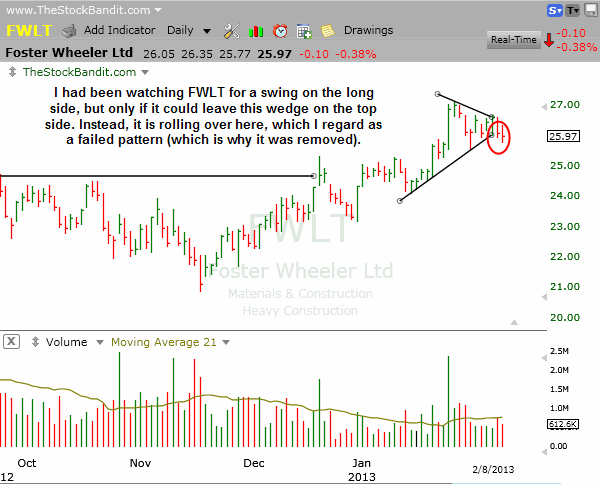
FWLT was setting up last week and I listed it for a swing trade. However, this one never triggered an entry and has subsequently rolled over to break down from what had been a bullish pattern building. This negates the setup, hence the removal from the trade list tonight. It also serves as a great example of why I like to wait for a pattern to confirm before entering, as this one didn’t cost me a cent with this failure.
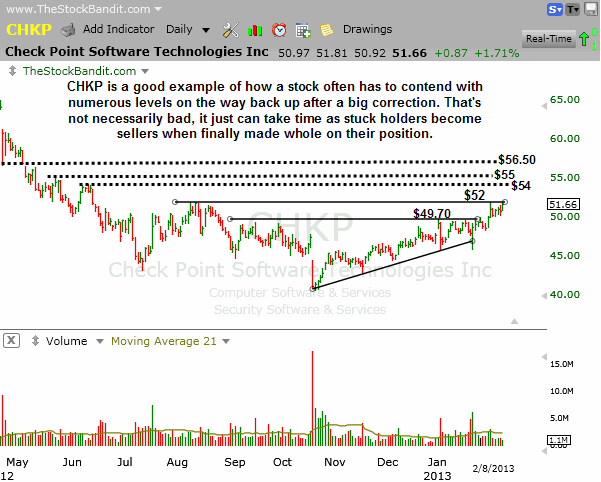
CHKP is trying to continue the recovery process since October, and it’s shaping up here as it comes into the next level ($52). It also is a good example of how after a big correction a stock will usually have to contend with numerous levels on the way back up. Those who missed their chance to sell on the way down then become sellers on the way back up, which can slow the pace of an advance.
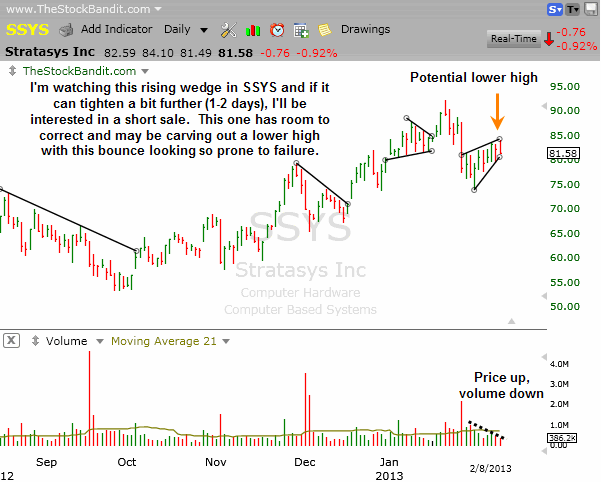
SSYS is building a rising wedge pattern here. These are typically bearish and tend to get resolved to the downside as a bounce fails or as price simply moves laterally and breaks the lower trend line first. In this case, it also appears to be a lower high in the making, so I’m interested in this setup for a play on the short side. If it could build for another 1-2 days, I’ll likely list it for a swing trade on the short side as that would tighten this wedge and create some narrower risk than this one entails tonight (distance from entry to appropriate stop loss).
New Swing Trade Candidates:
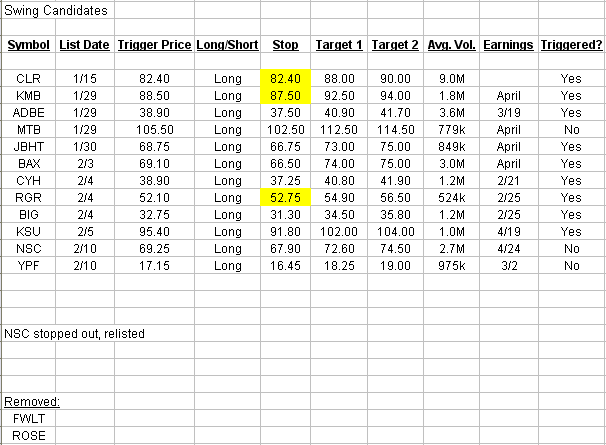
These stocks look ready for imminent multi-day moves. Pattern confirmation occurs with a move through the entry level. Initial stop and target levels are also provided.
NSC was shaping up last week and I set it up for a swing trade. It triggered and then abruptly stopped me out, handing me a small loss in the process. As it turns out, I was early and the pattern itself has matured a bit and looks good here again. I’m setting up another play with similar levels to give this one a 2nd chance, looking to get long if this compression pattern is resolved to the upside with a push through the trend line at $69.25.

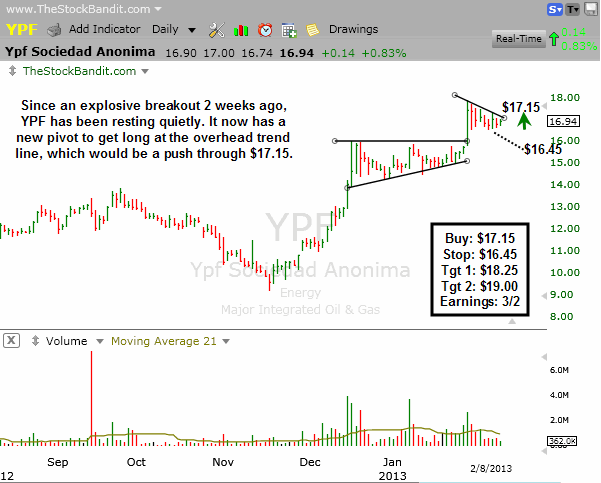
YPF popped big when it cleared the $16 area a few weeks ago and since then it has put in some light-volume rest. That’s very positive, and now a new pivot has emerged on the chart with this small descending trend line. A turn up through $17.15 will trigger a buy for me as this one starts another leg up.
Bullish Watch (click for charts)
Bearish Watch (click for charts)
Trade Like A Bandit!
Jeff


