


Good evening StockBandits!
Last night I highlighted uptrend lines which were broken last week. I mentioned that pretty early this week we were likely to see whether Friday’s light-volume bounce was going to result in a kiss goodbye of the those trendlines from below before additional selling, or whether they’d be reclaimed.
This morning we saw a positive open to kick off the week, followed by new session highs some 35 minutes later. That marked the peak for the day and stocks rolled over hard from there. Soon the morning gains had been given back and every bounce for the remainder of the session was met with aggressive selling. In the end, the indexes finished at their worst levels as traders ran out of time before they ran out of inventory to unload.
The intraday reversal today painted large bearish engulfing bars on the daily charts, and with that taking place after last week’s shift of character, it’s undeniably bearish in the short term. The rally had become long in the tooth some time ago, yet had continued running at a slightly choppier rhythm since the start of February. Now we’re entering into a corrective phase with the first real downside follow through we’ve seen since late December when the fiscal cliff crisis was the fixation of the Street.
Just how far this dip carries is too difficult to determine. So rather than predict where we’re headed, the best course of action is to adhere to stops on existing long positions and continue working the charts in search of potential support levels and new plays. Staying patient with deploying cash into the weakness will mean the difference between getting stuck and staying nimble, so even if this pullback results in a buying opportunity it’s best to let it run its course for now.
There aren’t many new plays to highlight tonight, so rather than force new entries I’m going to share a few more example charts than usual which can offer us some lessons and insights.
Let’s get to the charts.
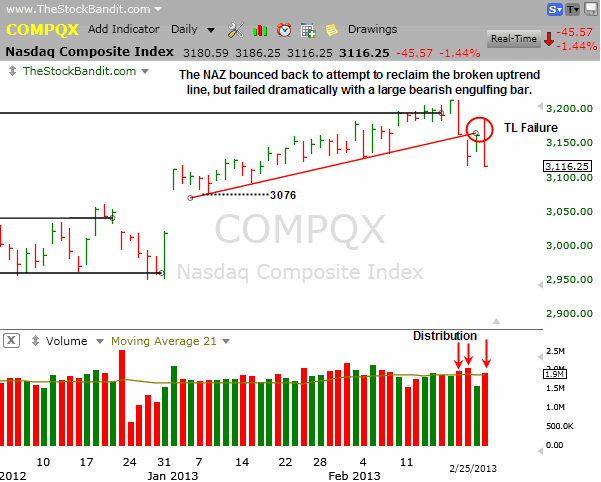
NAZ – The NAZ painted a nasty bearish engulfing bar today with the early strength and hard downside reversal to a new pullback low. This constitutes a failure to reclaim the trend line, and opens the door for continued weakness in the short term. Volume has been heavier on the downside with 3 of the last 4 sessions being distribution days.
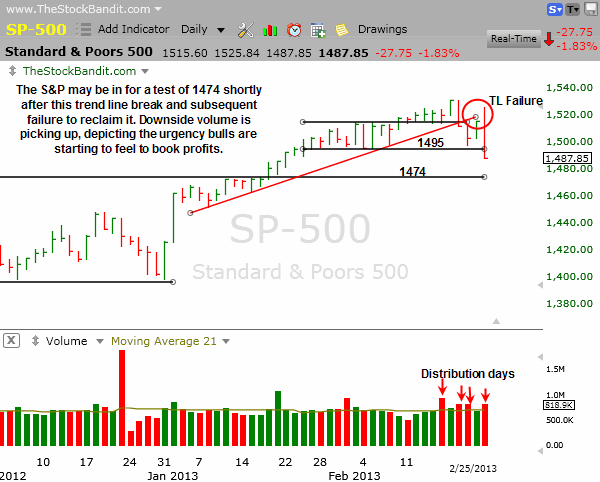
SP500 – The S&P attempted to reclaim its broken uptrend line today but failed in spectacular fashion as it gave up almost 2% on the day on increased volume. It also broke 1495, leaving the prior 52-week high of 1474 as next potential support.
RUT – The RUT is undergoing a real change of character here after a 21% rally from the November lows and then 3 serious declines in the last 4 sessions. Today it failed to reclaim the broken uptrend line and now is coming in to test 894. Next support zones are 883 and 868 at the previous all-time high. At this pace, it may not take long to get there.

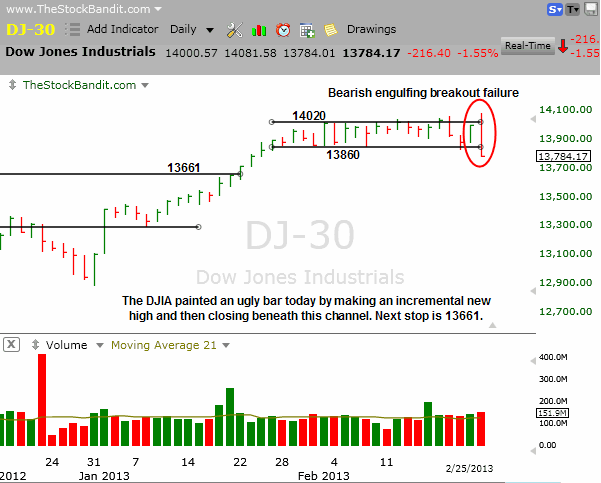
DJIA – The DJIA made a new intraday 52-week high today only to reverse hard and give up 216 points on the day. That left it beneath the multi-week channel, and now next support is 13661 for a possible test of the prior 52-week high.
Notable Names:
DGI was constructing a falling wedge pattern but today price broke down decisively from this pattern to negate it. In working my watch lists tonight, I see a number of these kinds of pattern failures, which simply means they need more work and trend lines need to be redrawn.

NAT is potentially shaping up for a longer-term trend change after a significant correction but a few months of constructive basing action. During that time it has carved out a few higher lows to show accumulation taking place, so now it needs to exit this wedge to the upside and start to gather some momentum. A bit more time in this wedge would benefit this setup and allow for a tighter stop loss compared to entry. Currently the upper trend line stands near $9.50.

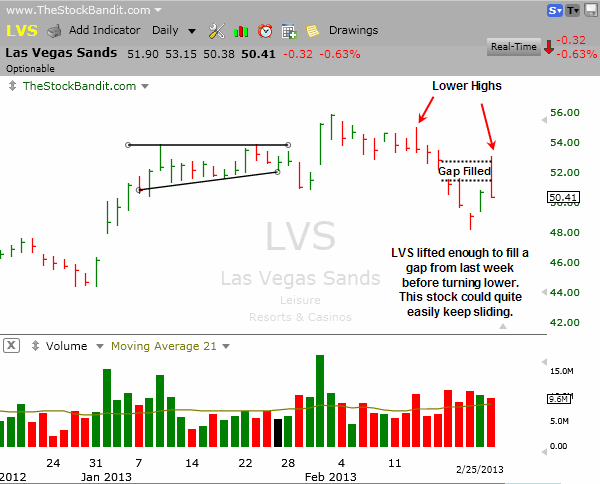
LVS is a great example of a stock jumping back and forth to fill gaps. Today it lifted enough to fill a gap from last week, only to reverse again and head lower. This one has carved out a pair of lower highs of late, and now looks ready to continue its correction.
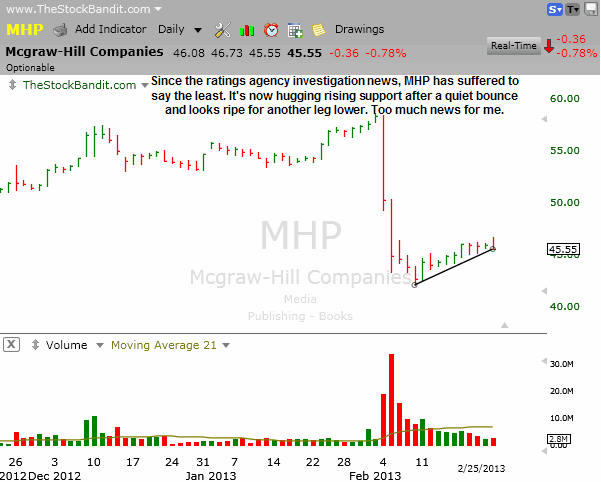
MHP is hugging rising support after a relatively feeble bounce attempt following the ratings agency investigations announced a few weeks ago. This one is simply too news-sensitive for me, but may offer a momentum play if it undercuts the trend line near $45.40.
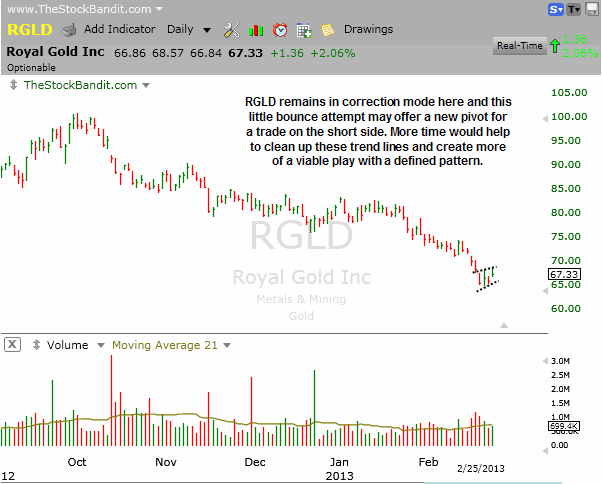
RGLD is in a downtrend and has attempted to bounce in recent days. This isn’t yet a positive change of character, so it’s more likely it simply needs a bit more time to set up another bearish pattern such as a pennant or flag.
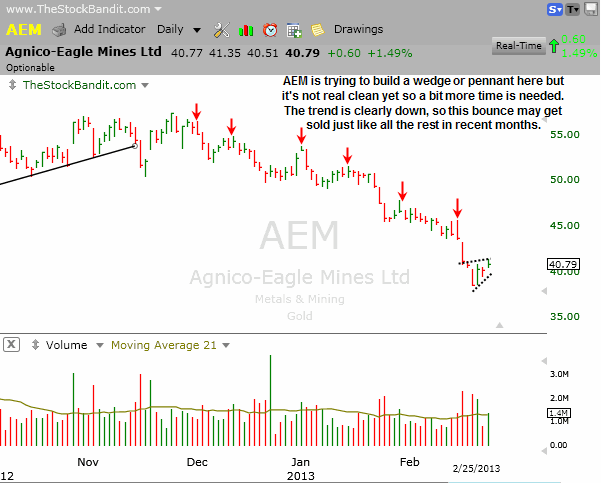
AEM is similar to RGLD in that it’s working on a pattern here but it’s not yet clean enough for a trade for me. The trend remains down, so I would expect this bounce to get sold once it stalls out.
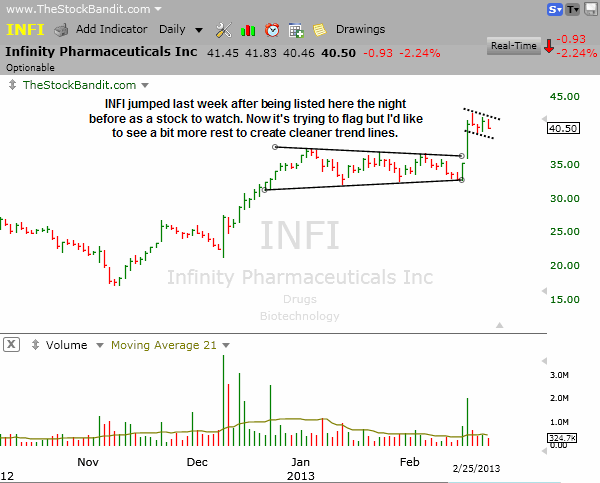
INFI is holding up well so far from last week’s breakout. I had pointed it out as a stock to watch and wanted to see the large wedge tighten, but it jumped right out of the base the next day without me. Here it is trying to flag but every day counts going forward to further validate this pattern and give some more distinctive trend lines.
New Swing Trade Candidates:
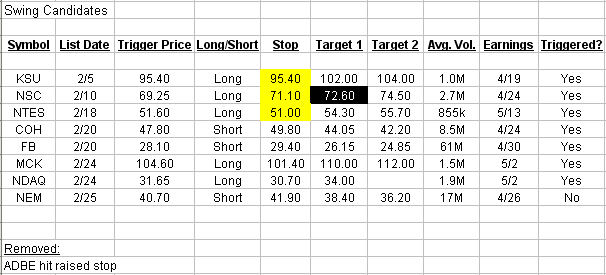
These stocks look ready for imminent multi-day moves. Pattern confirmation occurs with a move through the entry level. Initial stop and target levels are also provided.
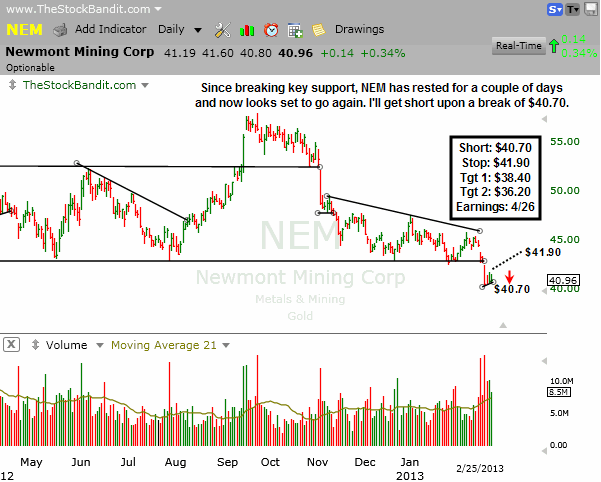
NEM is in a downtrend and last week it broke major support. Since then it has put in a little bit of rest and this sets up a new play on the short side. I’ll be using the bounce high from Friday as a protective buy stop, and will look to short this one upon a downside break of $40.70 as the downtrend resumes.
Bullish Watch (click for charts)
Bearish Watch (click for charts)
Trade Like A Bandit!
Jeff


