


Good evening StockBandits!
The market seems particularly adept at climbing the proverbial “wall of worry” and that’s exactly what it’s been doing ahead of Friday’s sequester. Tuesday’s upside reversal certainly wasn’t convincing given the low volume that accompanied it, although today we did see some follow through – including new 52-week highs for the DJIA (albeit on light volume).
The break of uptrend lines last week delivered some healthy profit-taking in the indexes, and for the last two sessions a bounce has been underway to potentially test the areas of those trend line breaches. We already saw a kiss of those trend lines on the NAZ, S&P 500 and RUT before further weakness kicked in on Monday and early Tuesday, but now the technical focus is on whether another bounce will fail.
I never want to make predictions, so I want to reiterate that before my next comment. But if topping is indeed a process (and I believe it generally is), then it’s possible we’re going through that kind of a process here. That isn’t at all to suggest that we cannot or will not break through to new highs, as that’s certainly a possibility, but as traders it’s always imperative to remain objective and consider every outcome. Given the length of the rally we’ve seen since November, it’s simply unwise to count out the potential for a deeper pullback. Please note that I’m not suggesting to short your initials and hope for the best. Rather, it’s a matter of taking clues from the price action and at the moment it’s difficult to argue with the volatility we’ve seen since last week that the short-term character has been different.
It’s entirely possible we continue to rally though, so I’d be remiss if I counted that out. I’m still in fact trading the long side, but I am hedged with some short exposure as well. While waiting for the indexes to show their hands my plan is to continue taking high-quality setups as they appear. Some may be on the short side, others on the long side, and as the market chooses a direction my exposure should naturally shift in that direction. That’s exactly why it’s so unnecessary to make predictions and then hope the market proves us right. Why not simply take the best plays and understand that they’ll naturally position us in the direction of the prevailing trend?
By the way, be sure to make your submissions for Thursday’s Charts on Demand video. I’m thinking of maybe cutting it down to just a handful of names for the sake of brevity…what do you guys think? Cast your votes in the comments section or by sending me a reply. Either way, I hope you’ll participate.
Let’s get to the charts.
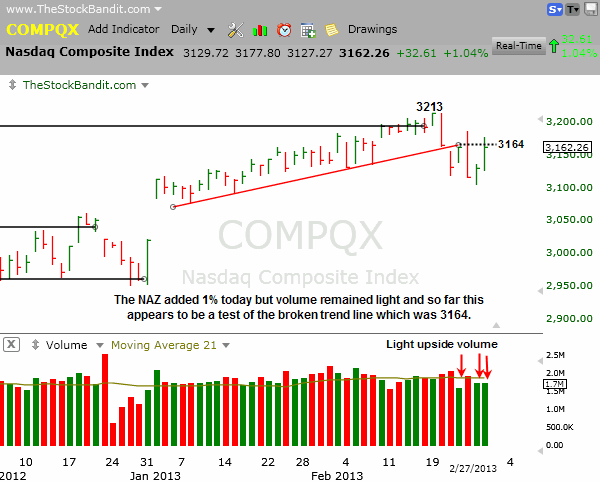
NAZ – The NAZ finished 15 points off its session high today to remain beneath last week’s broken uptrend line (3164). Once again, upside volume was weak just as it’s been in each of the last few advances in price. That’s being overshadowed technically by the heavier volume we’ve seen on declines, so if weakness returns in the short-term it could mean more wide-ranging bars like the emotional moves we’ve seen since last week.
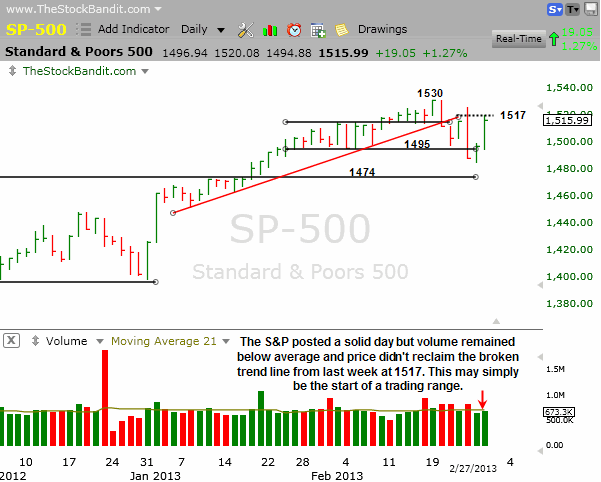
SP500 – The S&P showed some strong follow through today to Tuesday’s upside reversal but once again volume remained below average. This index is also still beneath the broken uptrend line from last week at 1517, making this an important test as we wait to see whether a quick return to the highs is in order or if instead another bounce gets sold.
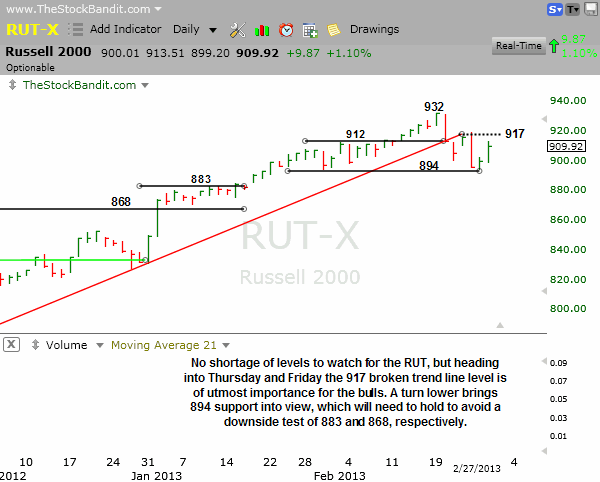
RUT – The RUT slipped a bit late in the day but still added 1%. Volume is not tracked for this index, so levels are all we have to go on. It remains shy of 917 where it broke the uptrend line last week, but is holding above 894 for now which is short-term support.
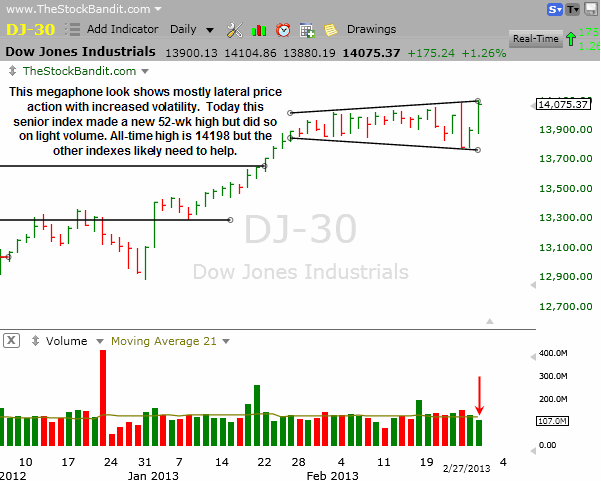
DJIA – The DJIA painted a new 52-week high today and this index continues to have trouble making up its mind directionally. Today’s strength came on even lighter volume than Tuesday’s lift, although the point gains were hefty. The story here remains one of follow through, which will likely require the participation of the S&P 500 and potentially the NAZ. It now has the look of a megaphone pattern, also known as a broadening top, so either volume needs to confirm this new 52-week high or an acceleration out of this area is needed.
Notable Names:
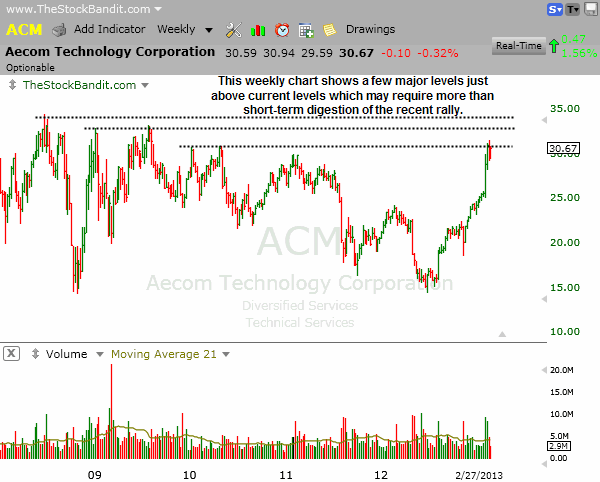
ACM is pulling back quietly here after a solid advance a few weeks ago, which creates a short-term pivot with potential for higher prices soon. However, it’s always wise to look beyond the short-term base just in case there’s something else lurking.

The weekly chart shows the stock is right near a few major longer-term resistance levels which could quite easily interfere with a target from the short-term pattern. It’s quite likely that this one needs to base further before an attack on the next levels.
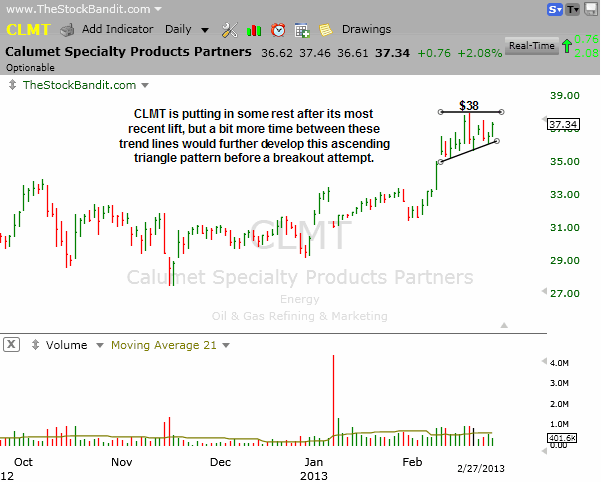
CLMT is resting here in a very constructive way with short-term dips still getting bought aggressively (rising support) as it churns beneath the high. A bit more time in this pattern would set up a potentially more explosive exit, as well as offer a tighter stop at the lower trend line since it rises daily.
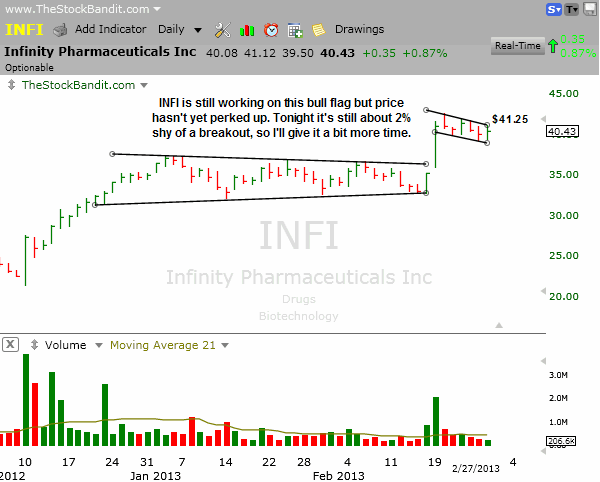
INFI is still building this flag pattern and volume is still giving no indications yet that a turn up and out of this little channel is imminent. It may go any day, but I’d prefer to wait until price begins pressuring the upper trend line or volume begins to pick up to suggest someone with deep pockets is beginning to accumulate shares.
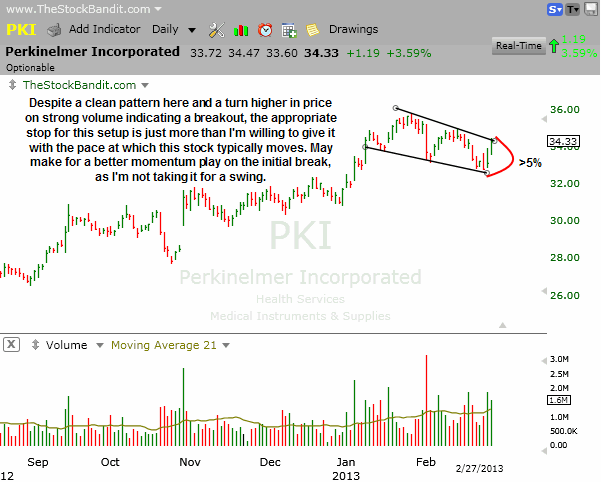
PKI is acting very well here with price lifting off the lower end of this channel on strong volume. Tonight it finished just a short distance from the would-be breakout zone, although the width of this channel just requires a wider stop than I’m willing to give this stock. If it were a more lively name with a recent history of making 20-25% moves, then a 5% stop would be more appropriate. Instead, the last rally was shy of 15% and coincided with a ton of market strength, so this is one I’ll pass on for a swing.
New Swing Trade Candidates:
These stocks look ready for imminent multi-day moves. Pattern confirmation occurs with a move through the entry level. Initial stop and target levels are also provided.
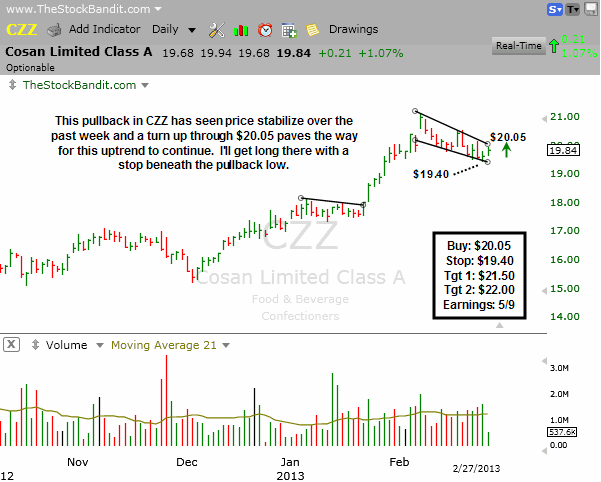
CZZ is channeling here in a quiet pullback from its recent high. The intermediate-term trend is intact, and the last similar pullback led to a solid advance. I’m watching for a break above the upper channel line at $20.05 to trigger a buy and looking for a similar move to the initial rally through the January trend line previously mentioned.
Bullish Watch (click for charts)
Bearish Watch (click for charts)

Trade Like A Bandit!
Jeff


