


Good evening StockBandits!
Last week was a wild one as the market resumed its correction early in the week. A hard selloff Monday was followed by a feeble bounce Tuesday, then new pullback lows into Wednesday morning. An intraday lift found follow through with a gap-and-go rally on Thursday, as well as a steady lift higher through Friday’s closing bell. In the end, we saw just a 22pt lift in the NAZ, a 14pt S&P bounce, a 95pt DJIA advance, and a 14pt RUT slide for modest net changes which didn’t come close to describing the whole picture.
We’ve had no shortage of V-shaped bounces going back to Nov. 2012, but this one seems a bit different. Previous V-moves have been of the 1-selloff variety, meaning the recoveries have tended to take place immediately after an initial pullback. With the current V-move, it’s happening after a secondary decline. The very strong closes of the past two sessions and the vertical nature of the lift looks a lot like short-covering. That isn’t to say it’s to be discounted as a rally, because longs have made real money and shorts have lost real money in this spike higher, but rather that it may not be as sustainable in terms of follow through. That’s no prediction, simply an observation.
The quick selloff and subsequent recovery we’ve seen in the past few days has left many charts with a sloppy appearance. Increased volatility like that doesn’t allow stocks to build new bases very easily, although there are a few outliers. Generally speaking though, we’ve snapped back violently with plenty of overhead remaining, so I’ll be watching for signs that the bounce is stalling to offer some rollover types of plays early this week. My watchlists are limited and I’m eyeing only a select handful of plays for Monday, and that’s ok. The key in trading is to continually take what the market’s providing in terms of play types and timeframes. This has proven to be a stick-and-move environment, so that’s what we need to do until it changes.
Let’s get to the charts.
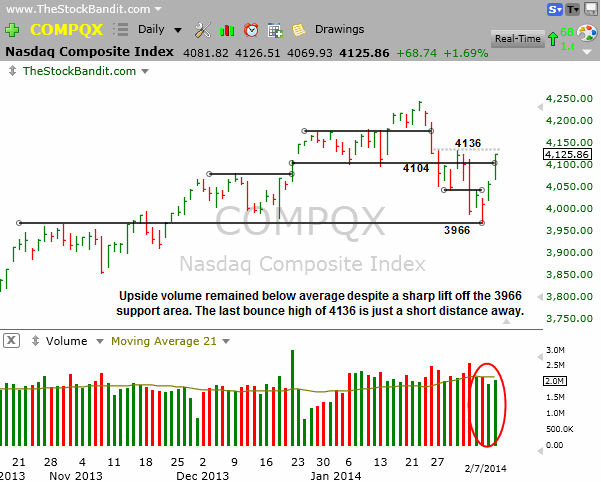
NAZ – The NAZ put up its first 100pt decline last week in more than 2 years, continued even lower, then bounced back enough to post a gain of 14 points on the week. That really puts it into perspective. It’s now facing the prior bounce high, which was minor, at 4136 and is stretched after tacking on 157 points in just 2 1/2 sessions. I’m expecting to see some backing and filling after this move, but we’ll see.
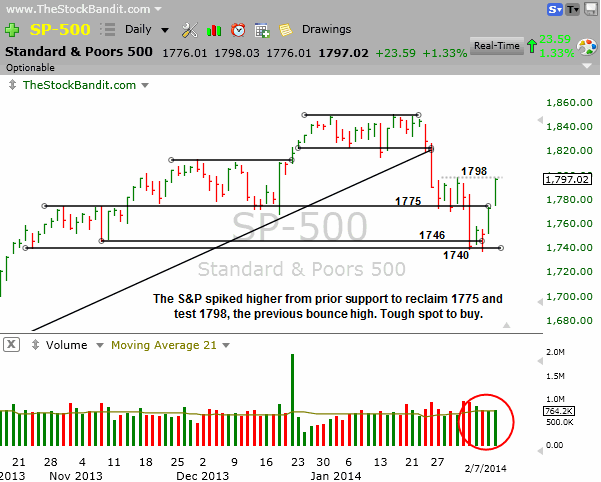
SP500 – The S&P tested prior support last week after a hard selloff through 1775, then rallied back 60 points to return to the previous minor bounce high of 1798. This erratic price action makes for some quick opportunities, but requires you stay nimble in such a fast-changing environment. Here again, some backing and filling is to be expected after such a hard snapback rally on diminishing volume.
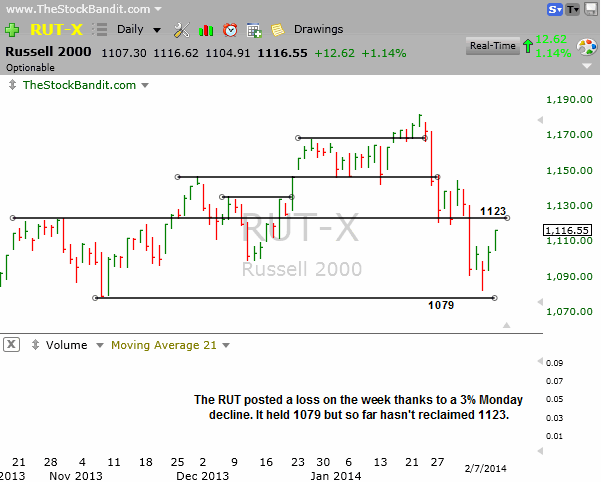
RUT – The RUT was the standout last week with relative weakness as it posted a loss on the week. It’s still shy of 1123 after breaking it Monday, but did hold 1079. There’s still considerable distance to the prior bounce high of 1144, so unless the buyers keep the pressure on we could easily see this bounce develop into another lower high.
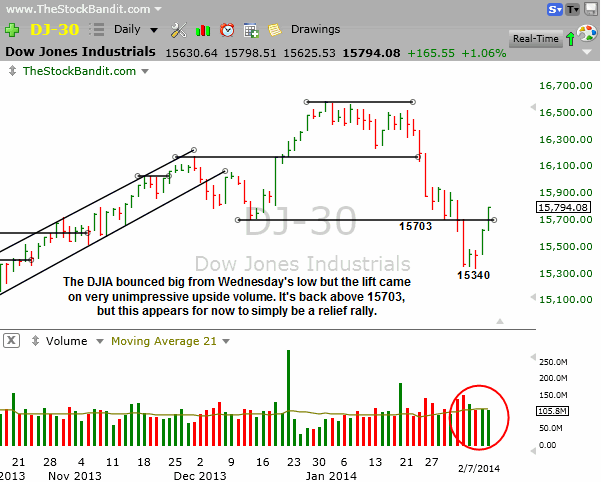
DJIA – The DJIA undercut 15703 then tumbled into the middle of nowhere with zero nearby support. It ultimately became stretched enough that a bounce arrived, taking it back above 15703 for the weekend. It’s still in poor technical shape and the squeeze-like lift on diminishing volume isn’t convincing yet.
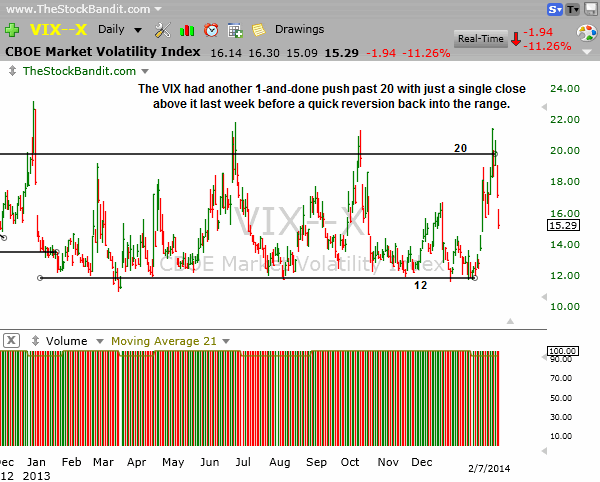
VIX – The VIX has for the past 18+ months had a history of closing once above 20 before immediately giving that level up. It did so again this week, quickly falling back into the middle of its range with the market rally. It’s still well off the 12 support zone, but should remain on the radar should we happen to see stocks turn back south.
Notable Names:
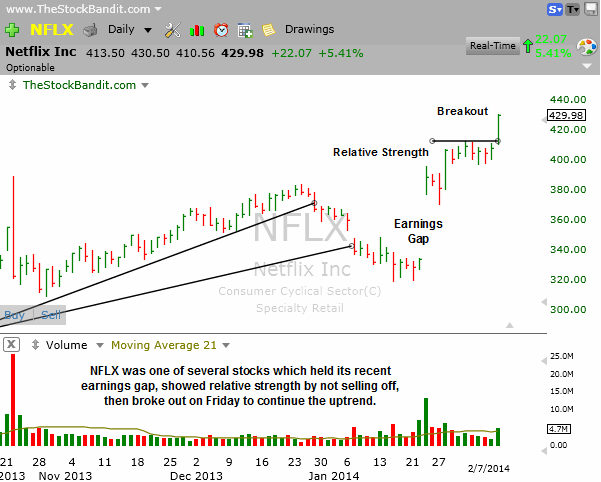
NFLX was like a handful of others last week which added to recent post-earnings gains. Relative strength is best seen when the market is selling off and a stock is simply holding its ground the way this one did. Friday’s breakout puts this back on the radar for momentum traders, although it’s very capital-intensive so not a stock I typically trade.
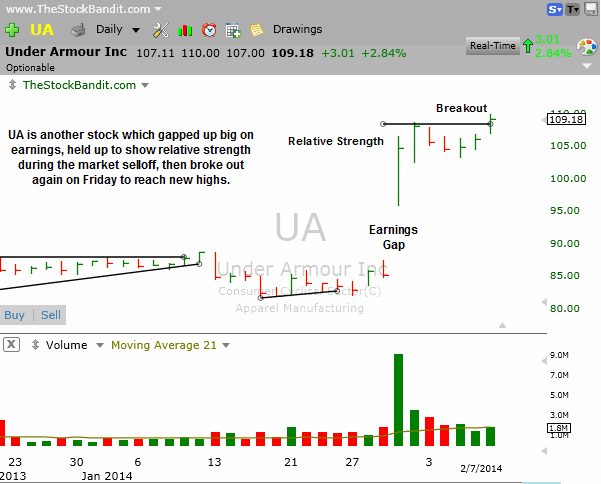
UA is another which gapped big on earnings, held its ground during the market pullback, then got back on the move Friday with an upside breakout. Prior to the gap up on Friday, it was still shy of resistance and therefore not on my radar. It’s one to keep tabs on now though as it makes new highs.
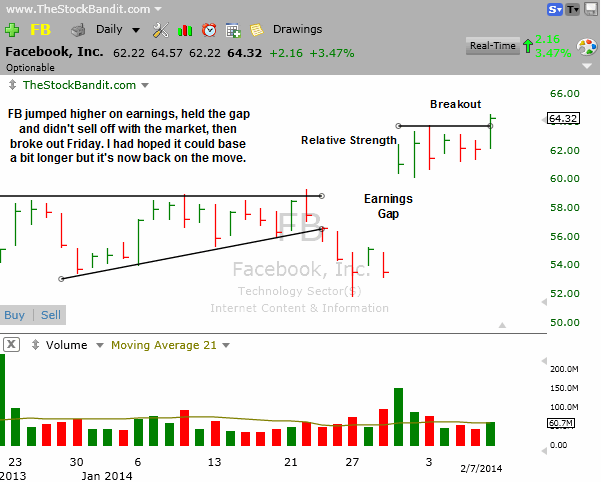
FB was on my radar and was highlighted here last week as a notable name building a high base. I had wanted to see the base mature a bit more but Friday it broke out on expanding volume and is now back on the move. I’m reluctant to chase it here so it will remain a watchlist stock for me.
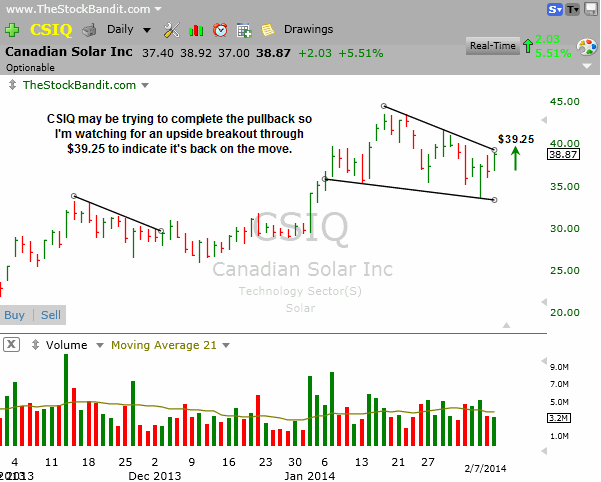
CSIQ is at the upper end of a wide base and threatening to break out. Given the very wide stop a swing trade here would entail, I’m going to instead opt for a single-day play if this one clears the trend line at $39.25 to participate in the initial breakout move.
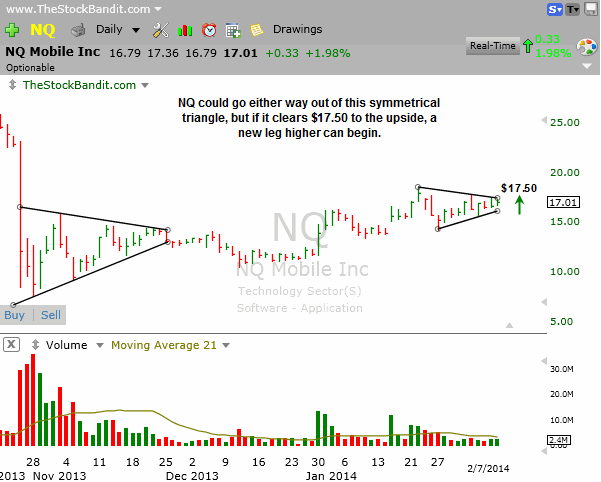
NQ is at the apex of this symmetrical triangle pattern and looks ready to go. I’m not interested in a short, so I’m watching for an upside push through $17.50 to signal it’s back on the move. This will only be a single-day play for me as I’m only interested in participating in the initial push higher.
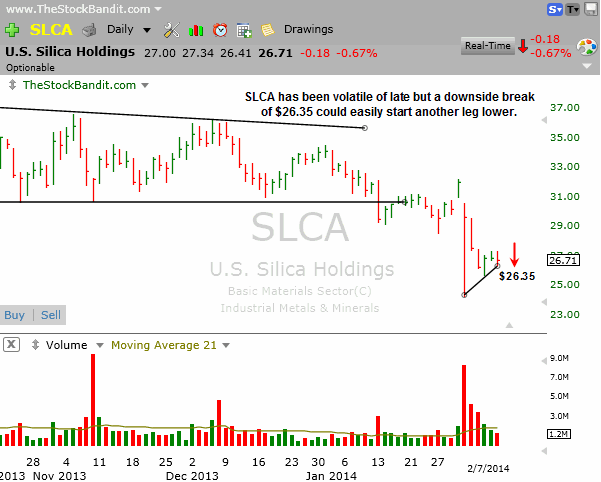
SLCA has been volatile lately but may offer another play here very soon on the short side. I’m watching rising support for a possible break at $26.35 to trigger a short sale. This will be a single-day play for me if it happens on Monday, as I’m only expecting a quick test of the low.
New Swing Trade Candidates:
These stocks look ready for imminent multi-day moves. Pattern confirmation occurs with a move through the entry level. Initial stop and target levels are also provided.
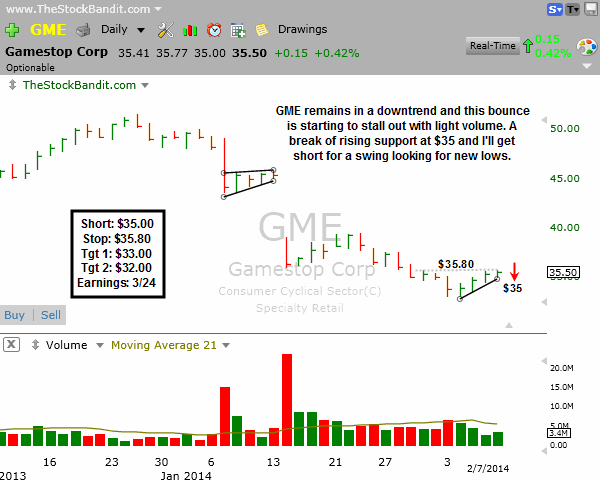
GME is still in correction mode but has bounced in the past four sessions. That lift has come on diminishing volume, and price only gained $0.15 on Friday, so it clearly lagged. This bounce looks to be running out of steam, so I’m looking to get short if it breaks $35 with a protective buy stop just above recent resistance and looking for new lows on the target side.
Bullish Watch (click for charts)
Bearish Watch (click for charts)

Trade Like A Bandit!
Jeff


