


Good evening StockBandits!
The DJIA continued to grab headlines today as it put up its 9th straight advance for its longest win streak in over 195 months! That’s impressive, no question about it. However, the pace has slowed noticeably in the past few days to raise questions as to whether this is simply a pause before continued strength or if instead this phase of the rally is in fact running on fumes.
The answer to that remains to be seen, but for now we do know the trend remains up and there’s still no reason to fight it – even if there are reasons to doubt it after this run. Tiny dip after tiny dip has been bought (there have been no big ones since Feb. 25), reiterating time after time the position of power the bulls currently find themselves in. That equates to timid bears, making for smooth sailing on the upside of late.
What has left fewer setups is the fact that the market has not based in recent days, which has left many stocks looking bullish but not necessarily in good spots for entries. Even a quick shake-up could do wonders for many charts, but for now it is what it is and as traders we have to continue to maintain high standards rather than chase extended names.
Let’s get to the charts.
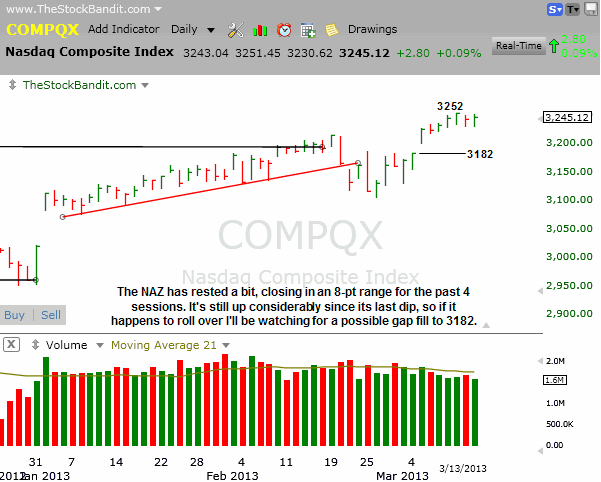
NAZ – The NAZ added a couple of points today on continued light volume to finish in the same 8-point finishing range of the past 4 sessions. This index has stalled out and the big question here is whether it’s due to roll over a bit or if it’s just resting before another pop. Should it be the former, the gap at 3182 will be the downside level to watch, whereas a push through 3252 paves the way for more strength.
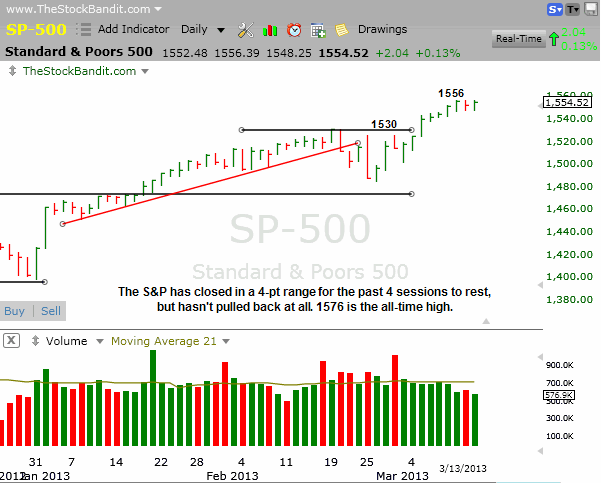
SP500 – The S&P finished in the same 4-point trading range for the 4th straight day as volume declined again. This index is still a bit stretched after its big rally from 1485, but with the all-time high not far away at 1576, the bulls may be hoping for at least a test of that zone before a pullback. Prior resistance at 1530 is the first downside level to watch should this index happen to roll over.
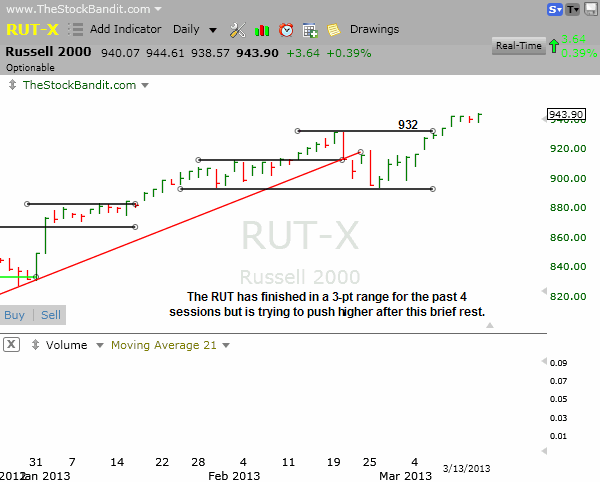
RUT – The RUT made another new all-time high today by pushing less than 2 points past Monday’s high. This index is up over 5% from the 894 level it bounced from 2 weeks ago, leaving it stretched and due for some profit-taking. However, it hasn’t kicked in yet. A dip may first test the 932 level, followed by the small gap to 916 from last week.
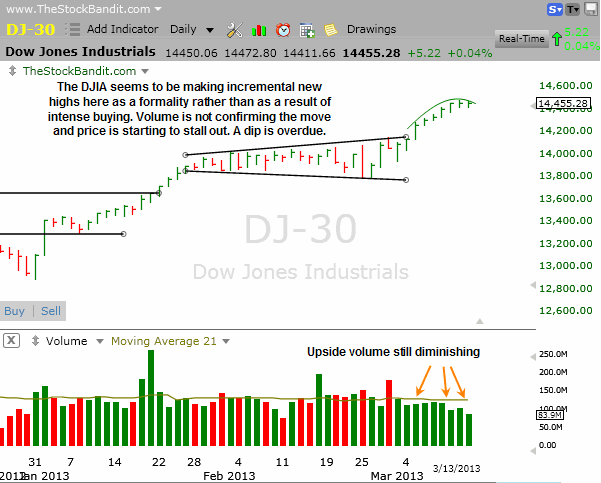
DJIA – The DJIA keeps making new highs but in the last couple of sessions that isn’t saying much. Today’s 5-point gain was far from impressive, although the bulls once again maintained their edge to push the win streak to 9 days. Needless to say, this index won’t rise forever, and it’s certainly due for some selling. The key will be how that dip gets treated once it arrives.
Notable Names:
BBRY is a good example of what can happen when a level gets tested and held and price begins to move away from it. Just last week this stock had tested the February low and didn’t break down. Since then, price has turned up and it’s now accelerating higher. In fact, it’s short-term overbought after this huge 24% run in just 6 sessions. Nonetheless, if a level can’t be broken in a meaningful way, the tide often shifts and the path of least resistance can quickly change.
 Why I Use TC2000
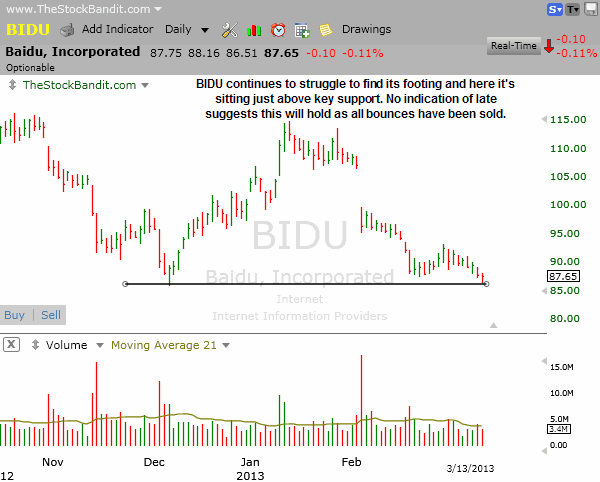
BIDU is still grinding its way lower and tonight it sits just above longer-term support. This one has slid in recent days and doesn’t have a well-defined pattern, so there is no play for me here. However, it’s one to keep on the radar in case support holds for even a few days as that could potentially set up a play.
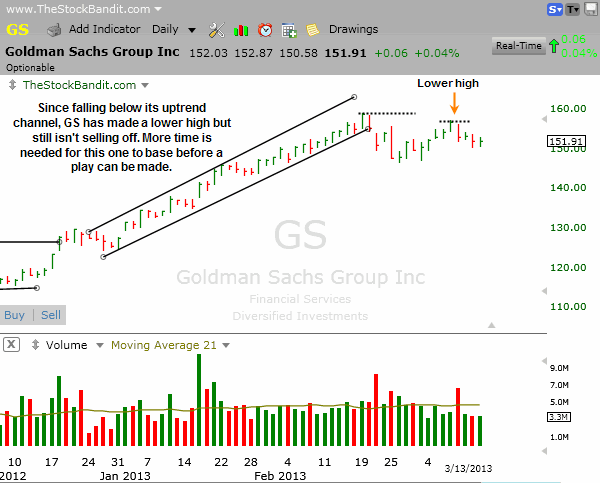
GS is giving some mixed signals here but overall it’s holding up rather well after a few weeks of mostly lateral movement. Since it broke below its uptrend channel, GS bounced to create a lower high, which often times gives stocks a bearish look. Instead, this one is still lifting from its session lows almost daily and therefore should not be discounted. More time is needed for a better defined pattern or base to form, but being a leader of the financial names, this is one to keep an eye on.
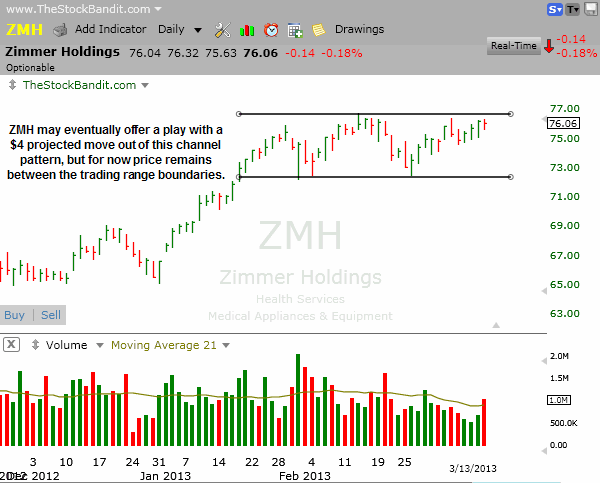
ZMH is stuck in a high channel pattern here which is a little more than $4 high. That could produce a measured move once price leaves the range, but for now it’s a stock to have on the radar. I’d like to see price bumping up against resistance and some more bullish volume (heavier upside volume) to indicate some accumulation, but it isn’t there yet.
New Swing Trade Candidates:
These stocks look ready for imminent multi-day moves. Pattern confirmation occurs with a move through the entry level. Initial stop and target levels are also provided.
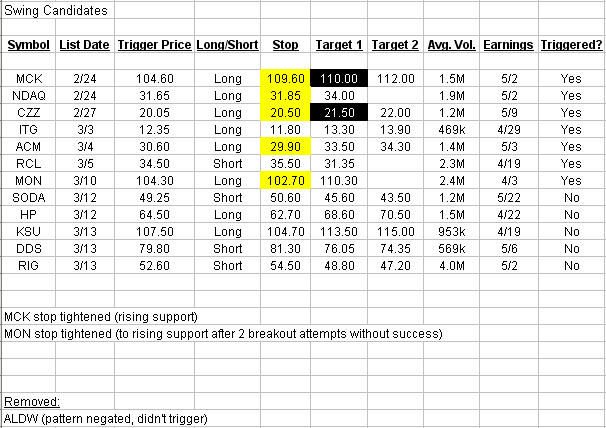
KSU worked out very well as a swing back in February and since my exit the stock has been moving laterally. It has created a new base with this ascending triangle pattern, and tonight price is getting compressed between lateral resistance and rising support. I’m looking to get long if this one clears $107.50 with a stop beneath the uptrend line and a final target of a measured move of the height of the triangle.

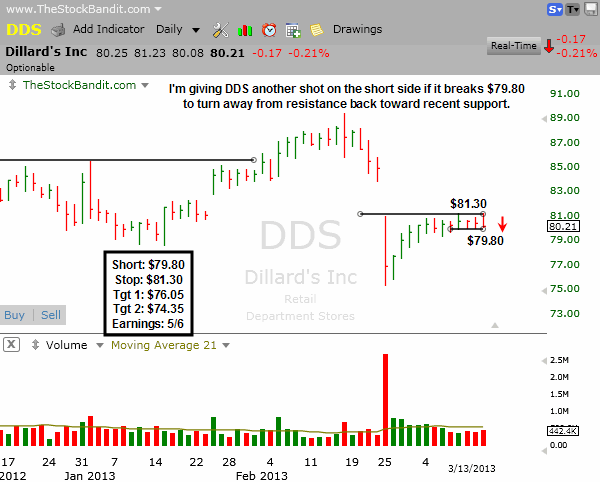
DDS triggered a short sale for me last week and then stopped me out. That has so far proven to be a headfake on the gap fill attempt, and price has moved laterally to give this chart a stalled-out look beneath resistance. Price is retreating just a bit here, so there’s potential for it to turn away from resistance and accelerate lower. I’m looking to short this one again to give it another shot if it makes a multi-day low with a break below $79.80. I’ll set a protective buy stop above resistance and will be looking for a test of the recent low, followed by a test of a level from last October.
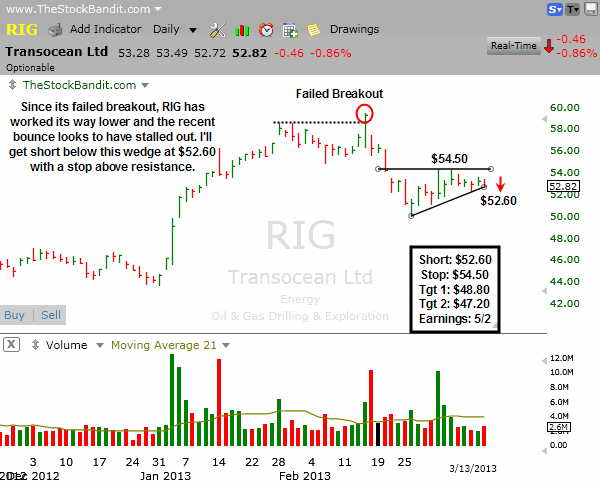
RIG failed a breakout several weeks ago and then rolled over. The bounce of the past two weeks has been feeble and price has only recovered a portion of what was given back in the selloff. There’s now a wedge pattern which I’m watching to trigger a short sale. If price undercuts rising support at $52.60, I’ll short this one with a buy stop above resistance at $54.50. It has room to tumble before former resistance from late last year would be tested.
Bullish Watch (click for charts)
Bearish Watch (click for charts)
Trade Like A Bandit!
Jeff


