


Good evening StockBandits!
The market peaked a week ago for the recovery rally off the February low. Early in the week, we saw some quiet profit-taking for a few days, but it was nothing out of the ordinary. The averages seemed to be behaving with no real acceleration to the downside or negative change of character. An intraday reversal on Wednesday actually gave the appearance that the short-term pullback might had run its course, and the positive close after tests of key zones set the stage for the bulls to potentially run again.
Then came Thursday.
Some early strength faded and evolved into a few hours of downside trending, completely erasing the notion that the pullback was done. The break of Wednesday’s lows put that theory on the shelf, and cash came out of the market pretty quickly as a large bearish engulfing bar was painted on the daily charts. The failure to lift on Friday on the heels of the selloff left both the NAZ and RUT testing very important areas at 4642 and 1182, respectively.
Perhaps it was geopolitical concern ahead of the weekend and an unwillingness to keep risk on, or perhaps the massive ramp we just completed was simply due for some selling. The market doesn’t move in a single direction endlessly, and given the overbought conditions of late, seeing the price action normalize a bit isn’t really surprising. Thursday’s downside reversal was surprising, but a pullback after a 4-week run of 7-12% is not.
So now we have the big question of whether or not we should expect more downside. Time will tell, but as we head into this week we have the two aforementioned levels, an S&P 500 which just failed its 1850 breakout, and a DJIA with a lower high already in place. If anything, it’s a great reminder to maintain stops and tighten up on long positions just in case the selling intensifies.
In terms of individual stocks, the erratic action of the past few sessions has left for many sloppy charts. There are some wide bases trying to form, but generally they need more work to mature before they’ll be swing candidates for me. For now, staying selective on the swing timeframe seems best while aiming for some cash flow trades via single-day moves.
Let’s get to the charts.
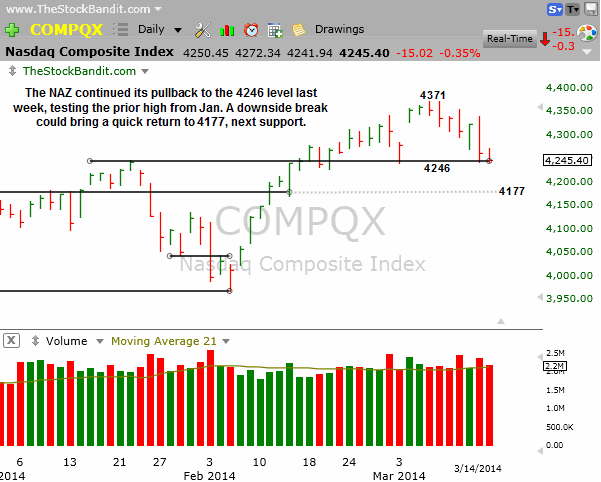
NAZ – The NAZ has now retreated to test the 4246 area once again. That was the January high, then served as temporary support in early March. This is a pivotal level, as a break of it could bring a deeper pullback. Next support is 4177.
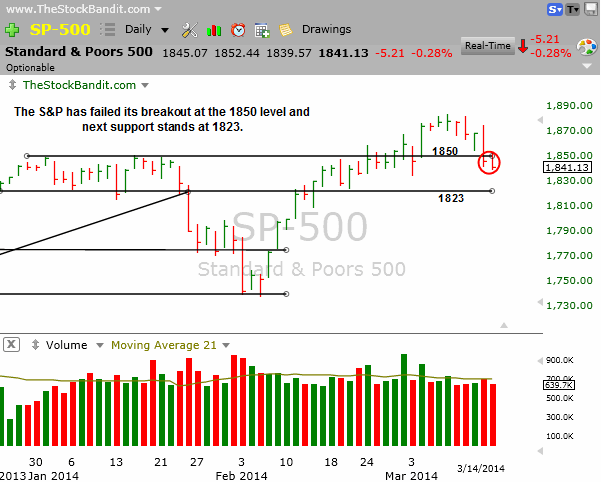
SP500 – The S&P struggled for some time to clear 1850, but finally did so a few weeks ago, initially in a reluctant fashion. It rallied up to 1883, but has now rolled back over to give up 1850. Next support is 1823, which is only about 1% lower from here.
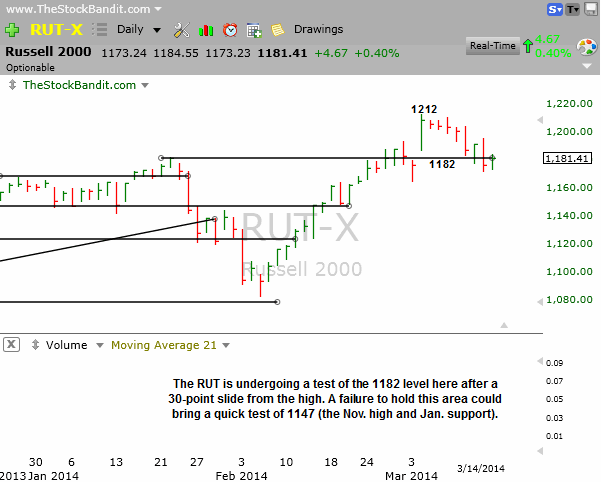
RUT – The RUT is attempting to hold 1182 here after a 30-point slide, but Friday’s lift wasn’t technically convincing. Not only did it fail to reclaim that level on a closing basis, but it was a minor gain and an inside day. Having rallied 12% off the February low, this index was certainly in need of a pullback. Now the only question is whether or not it will deepen.
DJIA – The DJIA has lagged the other averages and this lower high it just established confirms that. This index has also fallen back below 16174, leaving it nowhere near next support. It has a streak of 5 sessions in the red, which the bulls are hoping to break.

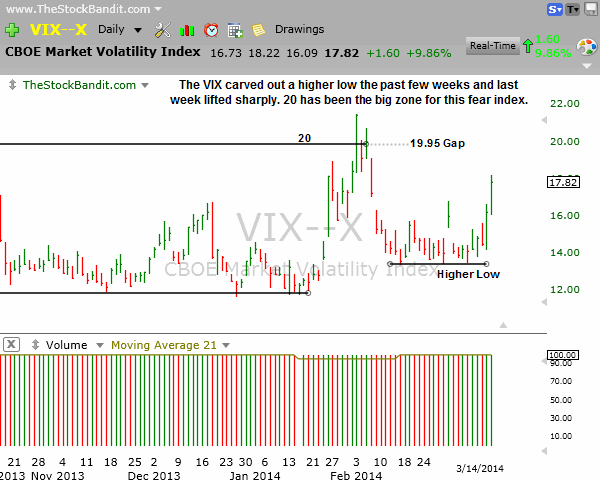
VIX – The VIX is the ‘fear gauge’ and it’s on the rise here after holding a higher level of support in the past few weeks. Next big upside level is 20, which we’ve not seen a multi-day close above in years.
Notable Names:
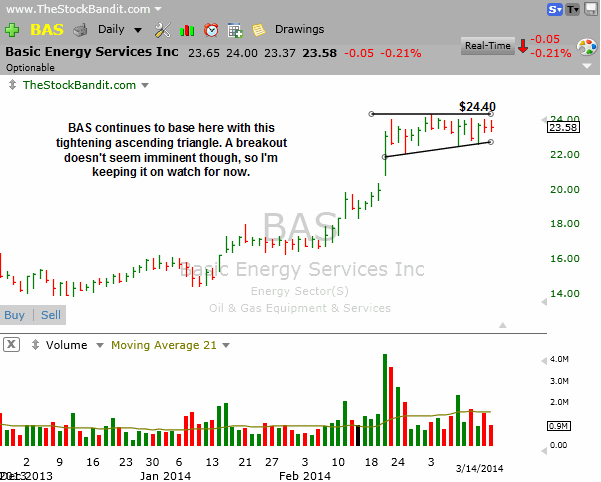
BAS is still building this ascending triangle pattern so I’m leaving it on watch. Specifically, I’d like to see price start to turn higher within the base to indicate an imminent breakout. Tonight, it’s stagnating in the center of the pattern.
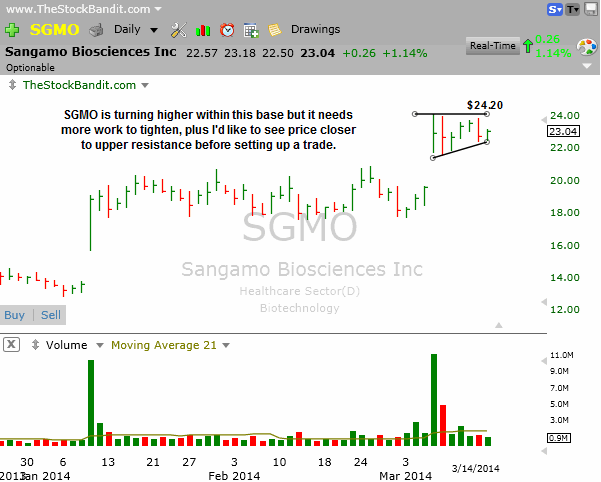
SGMO is also building a base here and on Friday turned higher from sh0rt-term rising support. Upside volume was lacking, and price still isn’t pressuring resistance, so I’m going to leave it on watch for now. I like bringing these developing patterns to you though, as it should help you see what I’m watching as these bases build and get closer to becoming potential trades.
KNDI is pulling back from the recent high but hasn’t yet stabilized and strengthened. It did close off its low on Friday, but for now I’m going to keep it on my watchlist instead of setting up a new play as I’d prefer to see some strength first.

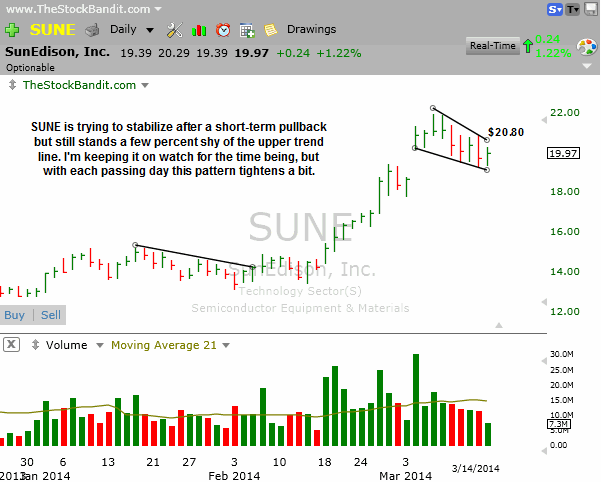
SUNE is turning higher within this falling wedge pattern and could soon be ready for a play. However, tonight it’s still a bit too far from resistance and upside volume isn’t starting to expand. It would be ideal to see both of those things change, so I’ll wait at least another day.
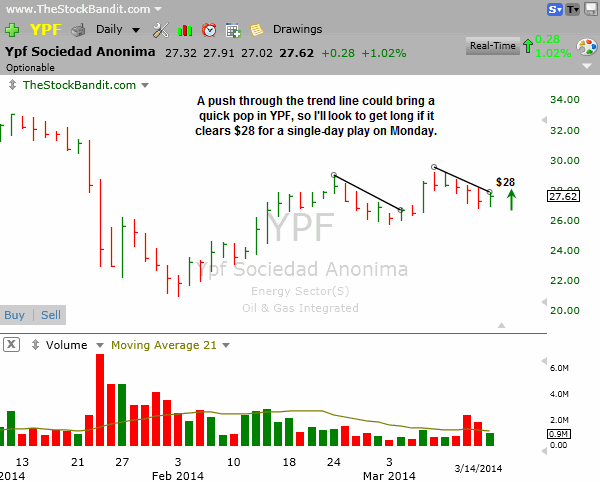
YPF is at the descending trend line here and a push through it would happen at $28. I’ll get long for a single-day play if that move happens on Monday, but only if. All I’d want to participate in would be the initial turn higher.
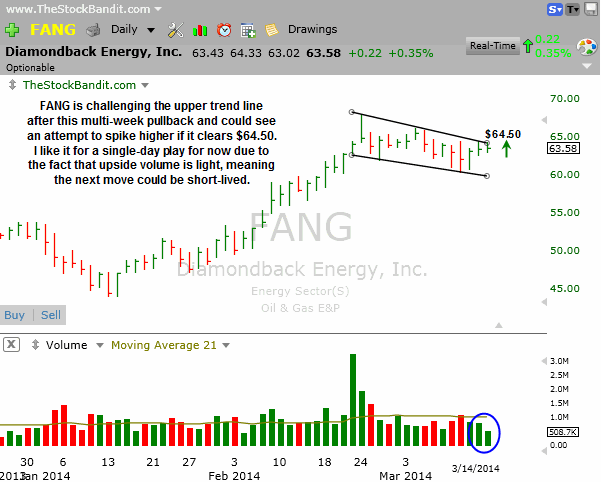
FANG is at the upper trend line of this descending channel after a shallow but prolonged pullback. A breakout through $64.50 looks good to me for a single-day play on the long side if it’s cleared on Monday. I’ll wait for the break before entering, as I’m not interested in owning it at any price beneath the trend line.
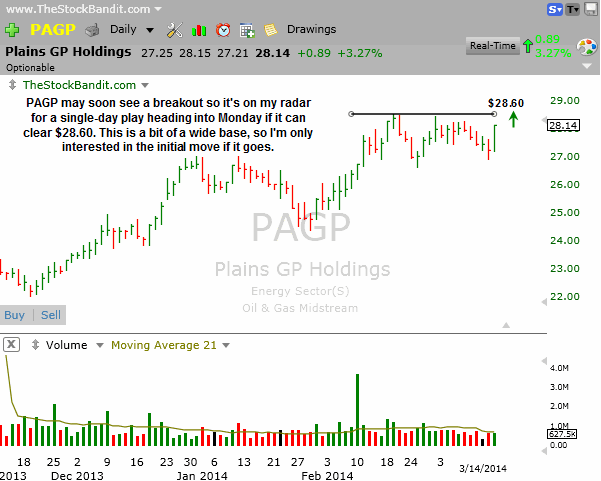
PAGP is turning higher here toward resistance. It still has a bit of room before a breakout would occur, but Friday’s strength was convincing. I like this best for a single-day play if it can clear $28.60 on Monday, as this base is still too wide to consider a swing for me.
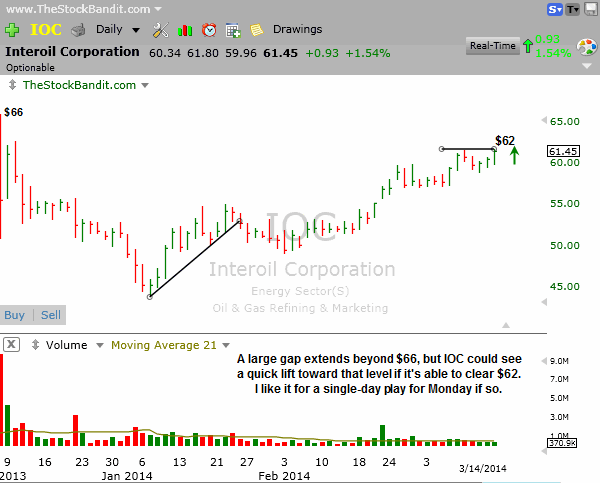
IOC is trying to rally here and a push through $62 would clear short-term resistance and open the door for a push back toward the unfilled gap from December (which starts at $66). I like this setup for a single-day play to grab the next quick pop and then move back to the sidelines as it approaches the next key area of resistance.
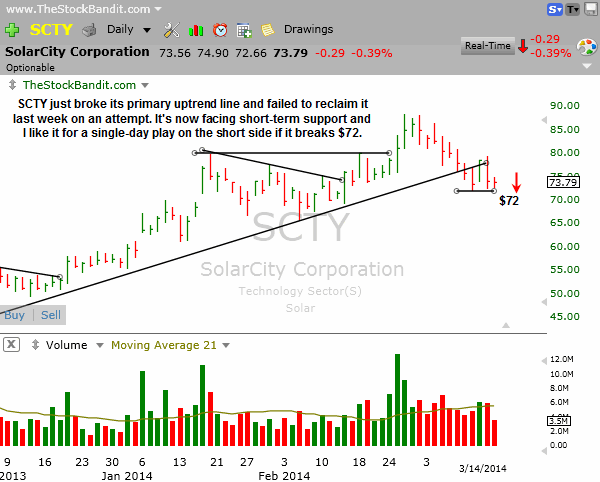
SCTY has been weak of late with a break of the primary uptrend line and a failure to reclaim it last week on a snapback rally. It’s now sitting just above short-term support, and a break below $72 could be worth a few points for a single-day play on Monday. Here again, I’ll wait for the break as that would be my confirmation that the pullback is finding continuation.
New Swing Trade Candidates:
No new swing candidates tonight. Staying with light exposure as the major averages are giving mixed signals and no individual charts have a compelling pattern with a risk/reward profile I can’t live without. Waiting for the can’t-resist trades has served me well as a trader, and tonight they just aren’t present. Instead, I’ll stick with some cash-flow trades since that’s what the market has to offer.
Bullish Watch (click for charts)
Bearish Watch (click for charts)

Trade Like A Bandit!
Jeff


