Good evening StockBandits!
The title of this post is a bit misleading if I don’t clarify. I’m not rooting for a deep market correction, I’m simply noting that market participants are buying even minor weakness in a stubborn sort of way – as if they’re worried they may not get a chance to later (at potentially lower prices). Bears have stubbornly shorted into this uptrend, and they’re flat-out eager to cover into virtually any dip. Similarly, bulls have stubbornly put cash to work on a near daily basis, throwing caution to the wind without regard for the downside – even headline risk. As a result, we’re seeing a very buoyant market which has tried to pull back but still hasn’t gotten it done yet.
While we’ve had a little selling over the past few sessions, the indexes have only pulled back only about 1%. That’s far from ‘correction’ territory, as it could be made up literally overnight. Many are anxious to call a top, but the fact is that even if the highs are in place it will still likely be a process of high-level churn before a lasting change of direction is seen. Stated otherwise, the propensity of the bulls to buy dips and bears to quickly cover into a slide could keep the immediate downside somewhat contained. Whenever this market does finally exhaust itself, it quite likely will be more reflective of the quiet lower highs we saw last October rather than a waterfall-type of move right off the highs.
Tonight there isn’t a lot to show in the way of new setups, as my aim with trades is to always go with quality over quantity. There is one new setup which looks ready for a move, so I’m setting it up, and there are several good example charts with pertinent lessons I’ll review as well. Tomorrow we have the FOMC announcement at 2pm ET and a Bernanke press conference at 2:30pm ET, which are the big events of the day with the greatest potential to move the market. Let’s get to the charts.
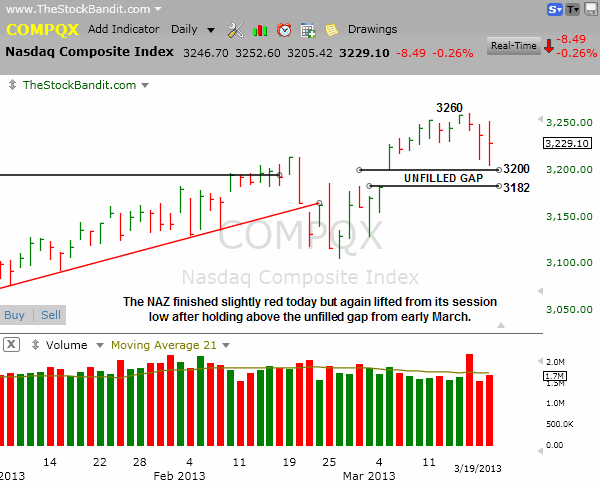
NAZ – The NAZ pulled back again today but only finished down 8 points after tagging 3205 to hold above the unfilled gap from earlier this month. This high-level basing action is bullish, as is the fact that we keep finishing off the session lows.
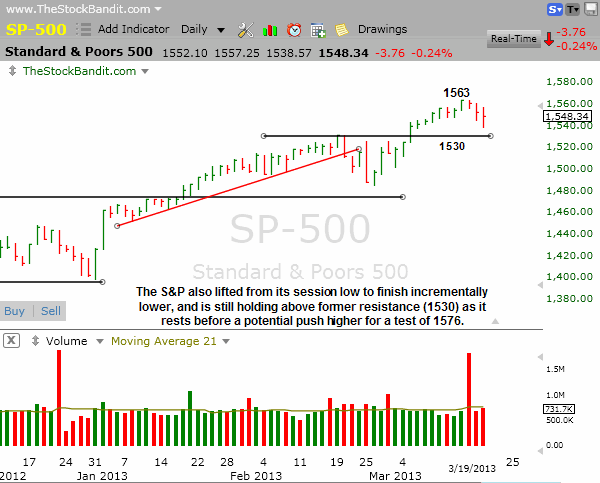
SP500 – The S&P gave up just 3 points today and also was able to hold above former resistance at 1530 with an intraday low of 1538. This index continues to rest here ahead of a possible push toward 1576 to test the all-time high. The short-term high of 1563 is just 1% away and is the first level to watch on the upside.
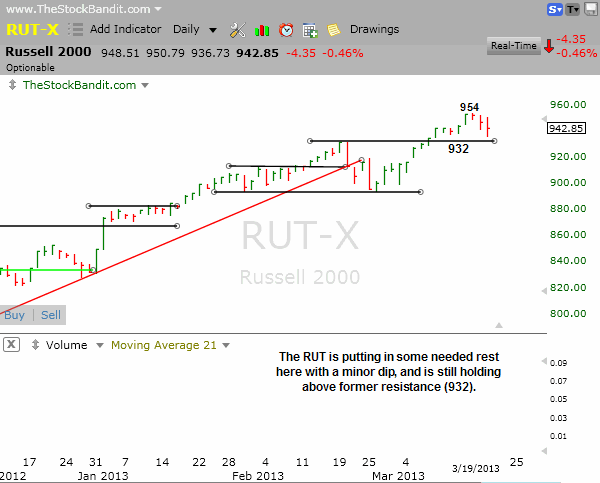
RUT – The RUT is resting here above former resistance and currently sits just about 12 points shy of its high. This index also has lifted from its session lows the past 3 days, despite finishing in the red. That points to dip buying and should not be ignored.
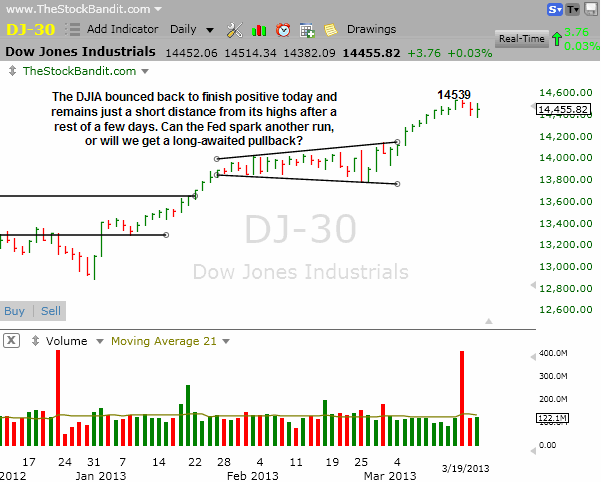
DJIA – The DJIA rallied enough from its mid-day low in the red to finish green, leaving it just about 85 points shy of its high. This index could stand to rest more, although the bulls have done well producing plenty of recent momentum and may not be able to stay away for long, we’ll see.
Notable Names:
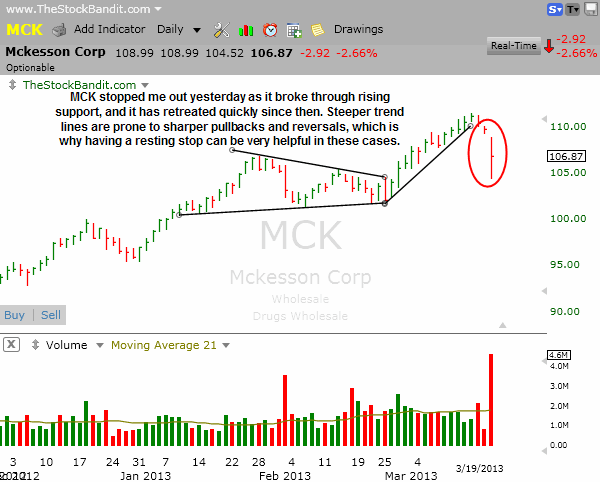
MCK is a good example of what can happen when a steep trend line gets crossed. You may have noticed how I kept raising my stop for this position as rising support kept climbing, and this is why. I was taken out of the position yesterday and then today it gave up more than $5 at one point before a late-day bounce brought it up from its low. The steeper the trend line, the sharper the move can result from it once it’s broken, so it was nice to be out of this one yesterday.
 Why I Use TC2000
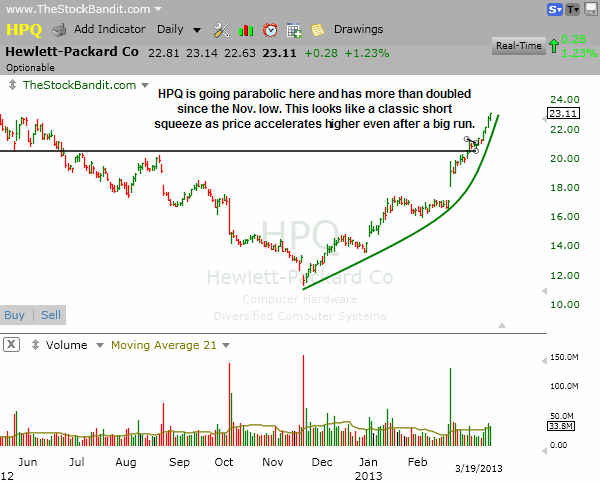
HPQ is running quite hot here despite more than doubling off the November low. This stock pushed past key resistance around $20.50, rested only a couple of days, and has resumed its climb. This is an emotional move which is clearly catching bears off guard, and this is what a short squeeze looks like.
 Why I Use TC2000
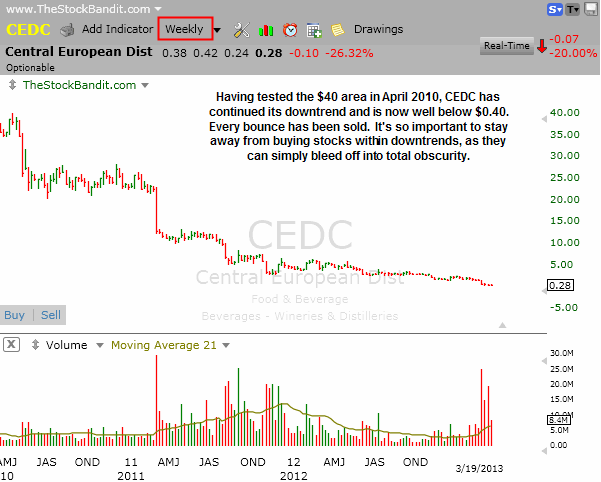
CEDC is a great example of what can happen when a trend persists. This stock was nearly $40 back in April 2010, but turned lower and every single bounce since then has been sold to keep the downtrend intact. This is now a penny stock, and serves as this week’s poster child for why buying a stock “cheap” isn’t nearly as good as buying an advancing stock.
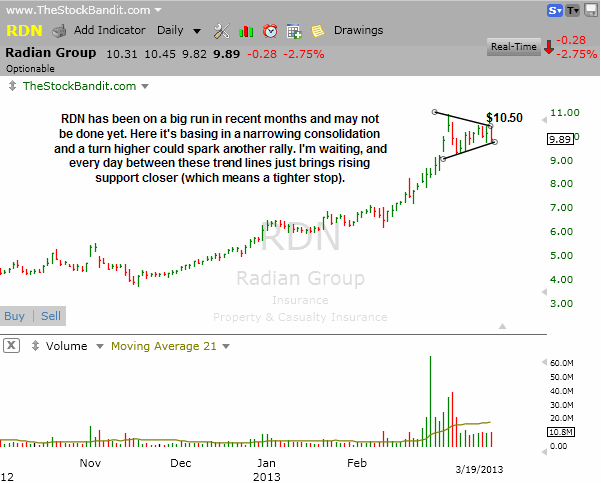
RDN is working on a narrowing consolidation here and price is getting compressed a little more from both sides by the day. A turn up through the upper trend line would free up price to move higher again, but today it pulled back and doesn’t appear ready. With each passing day, the technical buy point gets lower and the technical downside stop loss gets higher, making for narrower risk, so I’m fine to wait for now.
TIF is a setup I really like here and I actually went to set it up for a swing tonight, only to discover it is set to report earnings on Friday. That’s not enough time to warrant a swing, regardless of the quality of this setup, so this is one that might offer some opportunity as a momentum play instead.

New Swing Trade Candidates:
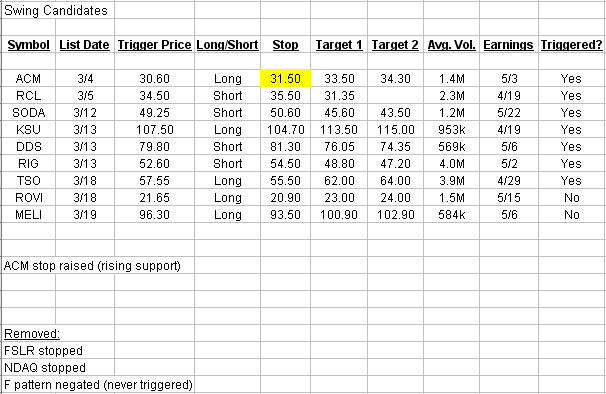
These stocks look ready for imminent multi-day moves. Pattern confirmation occurs with a move through the entry level. Initial stop and target levels are also provided.
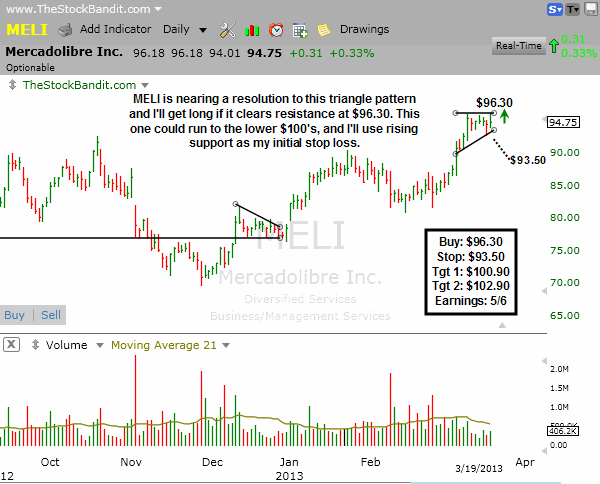
MELI is basing here just beneath its highs and dips are still getting bought. A breakout through $96.30 will trigger a buy for me as this one heads toward triple-digit land. I’ll be using rising support for my stop, and will target a test of resistance from 2012.
Bullish Watch (click for charts)
Bearish Watch (click for charts)
Trade Like A Bandit!
Jeff