


Good evening StockBandits!
The market essentially churned last week with a mixture of advances and declines as traders dealt with concerns over Europe/Cyprus along with the enthusiasm that comes with a market sitting at multi-year (or in some cases all-time) highs. Ultimately, every one of the indexes finished with single-digit net changes from the previous week, so there really was not much taking place.
This equates to some much-needed basing action for the indexes, as well as for many individual stocks. The persistent strength we’ve seen in recent weeks hasn’t allowed for much lateral movement, much less any real retreats in the form of profit-taking. When that’s the case, every day of rest counts a lot and tends to go a long way toward preventing prices from becoming too stretched. With some gaps in recent days and a couple of wide-ranging bars, the pressure looks to be building as we head into a holiday-shortened trading week (the market will be closed for Good Friday).
Currently many stocks are basing and with each passing day, their patterns are becoming more valid. However, with the market on hold and with many stocks not yet pressuring their breakout zones, I’m not looking to force anything. Instead, I’m setting up the plays which look ready for imminent moves while waiting patiently on the others to continue the construction of their patterns.
Let’s get to the charts.
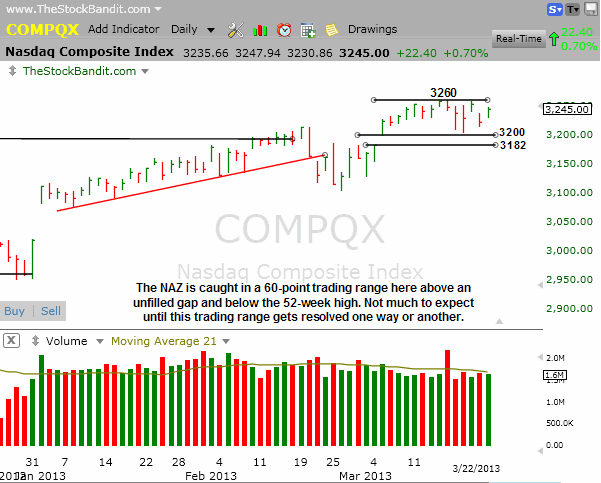
NAZ – The NAZ zigged and zagged last week but finished just 4 points below the close from the prior Friday. Currently it’s caught in a 60-point trading range beneath 3260 and above 3200. This channel could serve as a base for higher prices if we see this indecision resolved to the upside, but waiting for the breakout would offer confirmation of a new lift beginning.
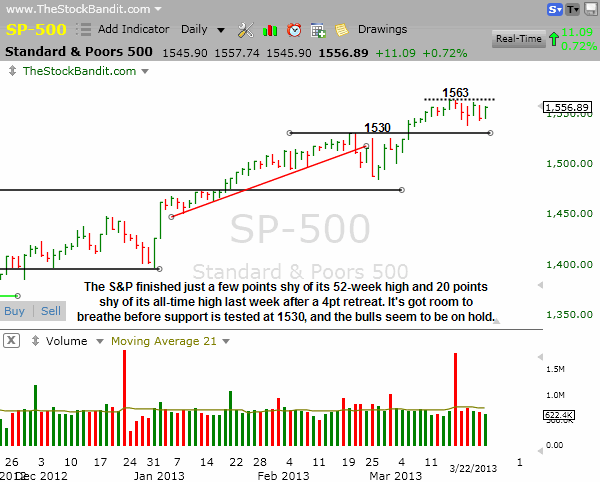
SP500 – The S&P also gave up 4 points last week, finishing just 7 points shy of its 52-week high and 20 points from 1576, the all-time high from October 2007. This index is basing nicely for the bulls, who haven’t allowed it to slip while they rest. This allows for some short-term breathing room down to 1530, as well as a high likelihood that any pullback from here could result in a higher low (vs. the late-February pullback to 1485).
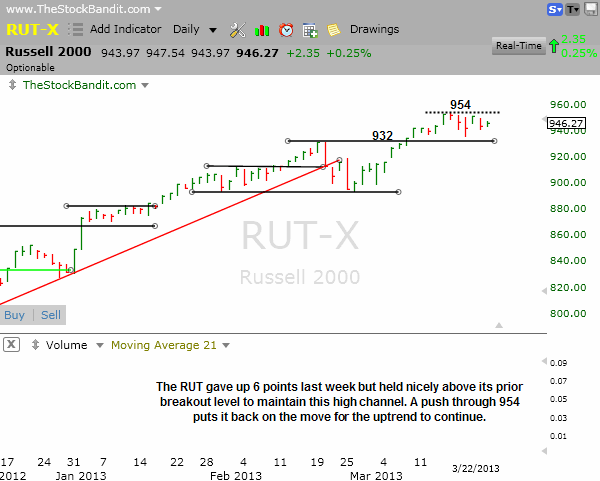
RUT – The RUT has held up extremely well for an index that’s resting after a huge rally off 894 support in February. Here it sits less than 1% off its high with a little more room down to 932 as short-term support. A break below that would invite a potential gap fill to 916.
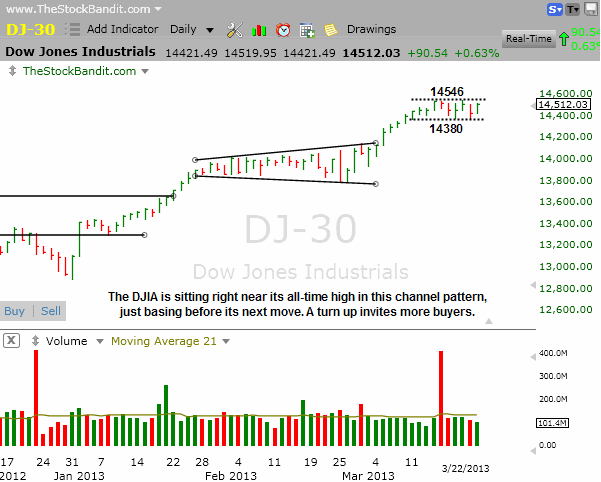
DJIA – The DJIA continues to captivate Main Street as it sits near all-time highs. Last week it gave up just 2 points, so it was a truly quiet week. This high channel could quite easily be resolved higher, but for now every day of rest is healthy to see.
Notable Names:
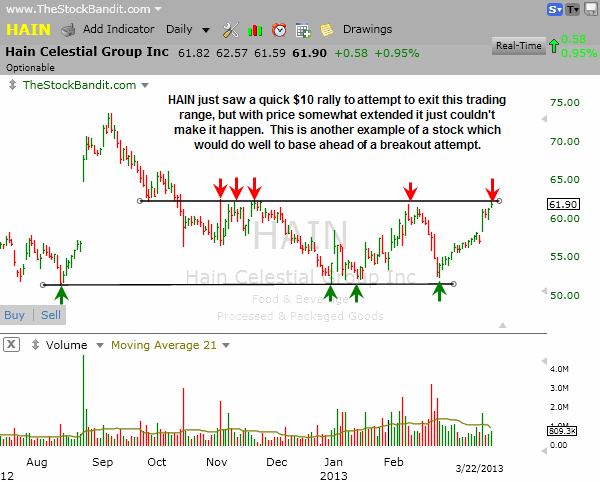
HAIN is a good example of a stock coming off a big run to challenge key resistance, only to get rejected on Friday. Although this particular stock might be able to make it happen in the coming days, generally this is why I prefer to see price pause ahead of a breakout to reduce the risk of a failed breakout attempt.
 Why I Use TC2000
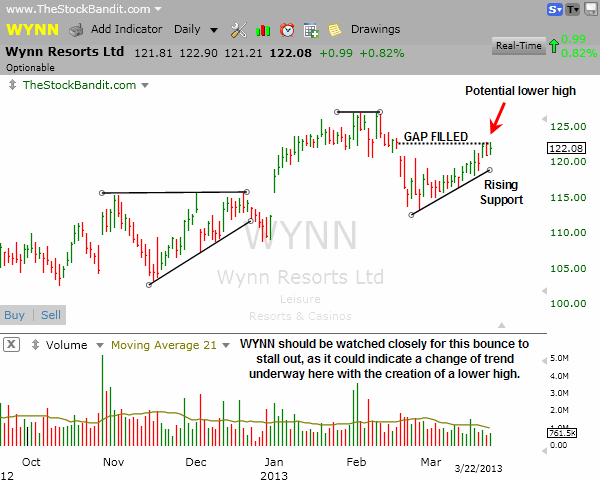
WYNN rallied up quietly to fill its gap from mid-February, but looks to be in danger of carving out a lower high here on the daily chart. Coupled with rising support, a turn lower would be a bearish development and a potential trend shift worth watching.
 Why I Use TC2000
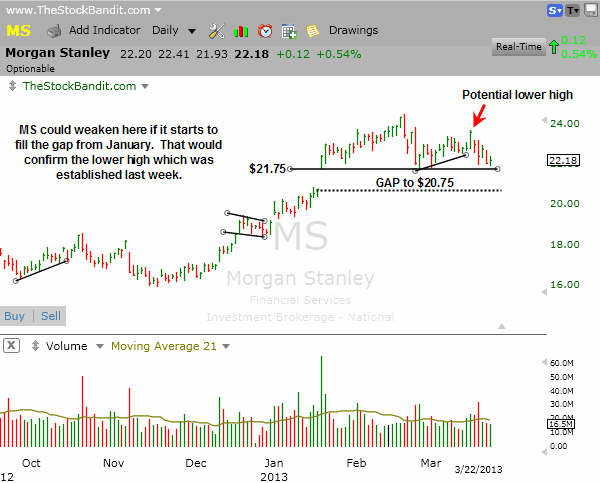
MS is a key financial stock which has really stalled out of late. Here it’s in danger of confirming a lower high if it starts to fill the gap from January below $21.75. Financials have helped to provide a nice lift for the S&P so far in 2013, which makes this a setup to keep on the radar in case others in the group begin to weaken as well.
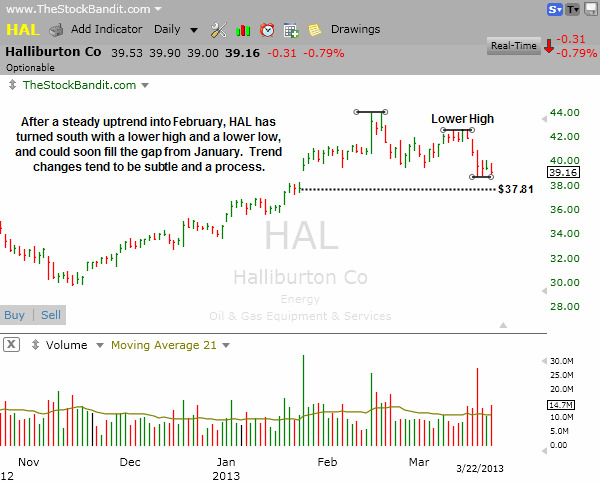
HAL is undergoing a gradual trend change here with a lower high and a lower low being carved out in just the last 2 weeks. There’s a gap to $37.81 which may get filled soon, but overall this chart just depicts how trend changes often occur over time rather than one spooky event. That’s something to keep in mind for those concerned about a market top.
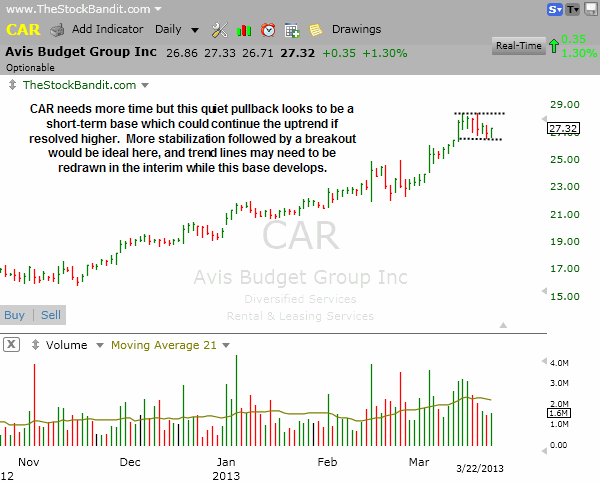
CAR is basing here after a minor pullback from its highs. More basing action is needed and this may form something other than the channel I’ve outlined in hash marks below, but the trend is up and eventually this one may mature into a cleaner pattern for a play.
GME is acting like it’s ready to go any day now as it challenges the descending trend line. A turn up through $25.90 would set it free to push higher, although earnings are due out on Wednesday so there just isn’t enough time for the stock to make a move big enough to offset the risk being taken for a swing timeframe. For that reason, it may be worth watching for a quick momentum play.
 Why I Use TC2000
New Swing Trade Candidates:
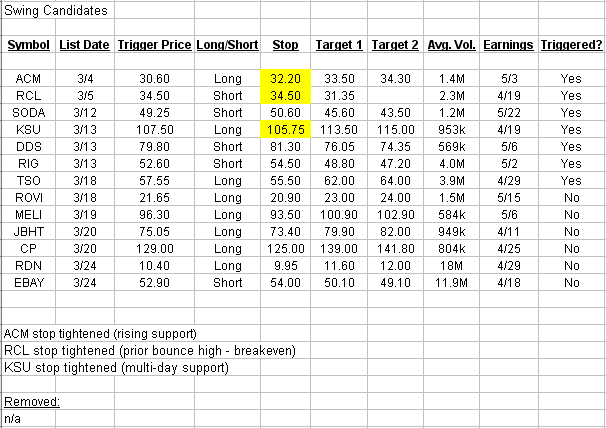
These stocks look ready for imminent multi-day moves. Pattern confirmation occurs with a move through the entry level. Initial stop and target levels are also provided.
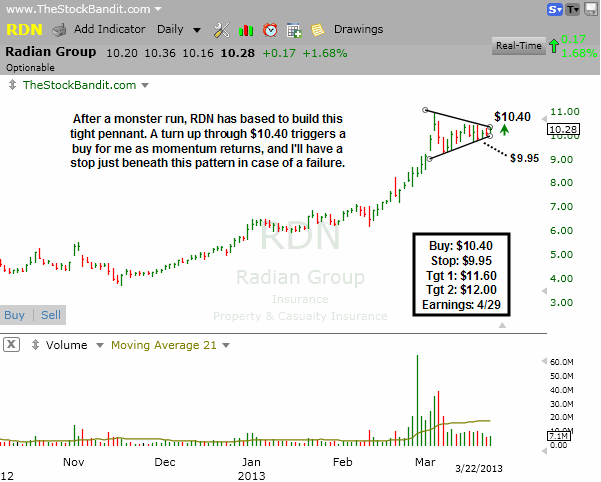
RDN has been constructing this bull pennant after a major advance, and this very tight price action means a resolution is likely in the next day or two. Given the trend is still up, I’m watching for a push through $10.40 to start the next phase of the rally. I’ll get long there with a stop just beneath support. I like the risk/reward here with price having the potential to accelerate here, and earnings aren’t due out until late April so there’s no rush.
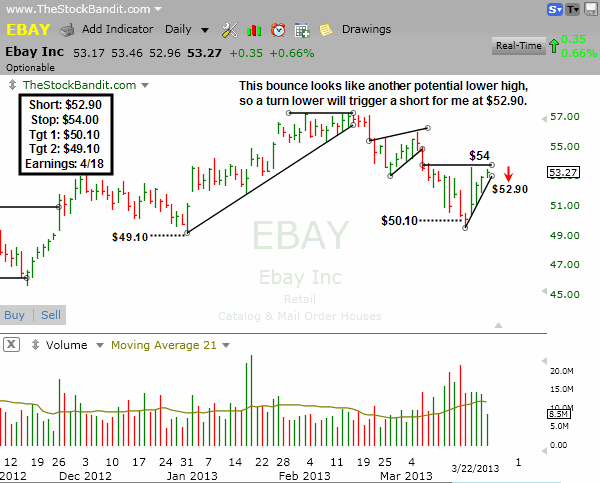
EBAY has carved out lower highs in the past several weeks and a turn lower from here at $52.90 would trigger a short sale for me. I like the well-defined resistance to trade against ($54), as that offers a spot for a protective buy stop to cover in case this one triggers then turns back up. Otherwise, it looks to have room to head down to test recent support, and possibly even challenge the area of the New Year’s Eve low. Earnings are almost a month away, so there’s ample time for this one to make a move and I like the risk/reward of this setup.
Bullish Watch (click for charts)
Bearish Watch (click for charts)
Trade Like A Bandit!
Jeff


