


Good evening StockBandits!
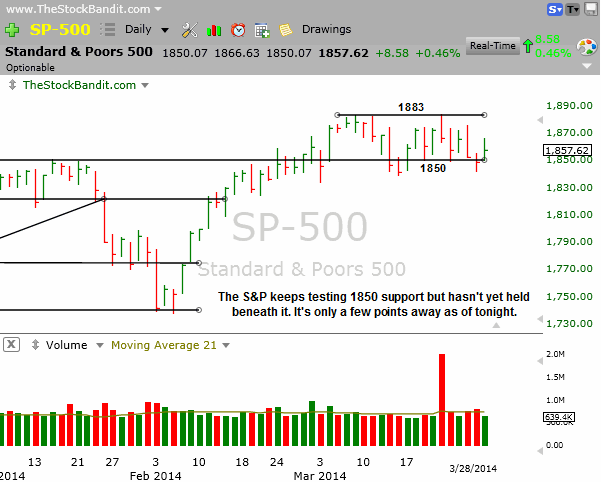
Three of the four main indexes I monitor each day lost ground last week, with the DJIA being the only exception. It and the S&P 500 held up better than the NAZ and RUT, which lost 2.8% and 3.5%, respectively. We saw declines in 3 of the 5 sessions, and even the pair of advances on Tuesday and Friday both saw weak finishes. The NAZ and RUT broke down hard from their recent trading ranges, but the S&P 500 was able to finish the week above 1850 despite a couple of attempts to break below it during the week.
At this point, what we have is a mixed market. The more speculative NAZ and RUT are telling us that the hot money is shifting to the sidelines as this pullback continues, while the blue-chip S&P 500 and DJIA simply keep churning laterally. One of these pairs is faking it! The best trading conditions tend to be when the broad market is moving in unison, but without unanimous breakdowns from the recent trading ranges, we’re missing that unity. It could happen anytime, but with the S&P less than 8 points above the 1850 level, it seems a rollover move by that index would most easily do the trick. The only problem is that it has had multiple opportunities to do so and simply hasn’t yet.
The site changes and server migration took place successfully last week, and so far all seems to be operating correctly. Hopefully you received the email I sent out earlier today outlining a couple of changes, so if you do not please ensure it wasn’t filtered out to another mail folder. If you still can’t find it, reply to this email and I can resend it. I’m excited not only about the updated look, but some of the things that the back-end changes are going to allow for us going forward. The server migration also ensured the most up-to-date security and stability, which is always a good thing. If you encounter any issues whatsoever, please let me know what’s happening, what OS you’re on, and which browser you’re using.
By the way, I’m still having some issues with my own email so if you’re waiting on a reply please be patient and I promise I will get to it!
Let’s get to the charts.
NAZ – The NAZ made a lower high at 4334 then last week it rolled over to break support at 4246 in a decisive way, ending the week 91 points beneath that level. This index is in correction mode, and it’s important to respect that until the dust settles. Next level to watch is the 4057 gap from early February which remains unfilled.

SP500 – The S&P keeps holding 1850 to maintain the range, but tonight it sits just a few points from that important level. It has on four occasions closed beneath 1850 since the first time it closed above it, but each time it has quickly rallied back to reclaim that level. With the NAZ showing so much weakness, it could be that we don’t have to wait long for a resolution to this range. For now, however, the wait continues.
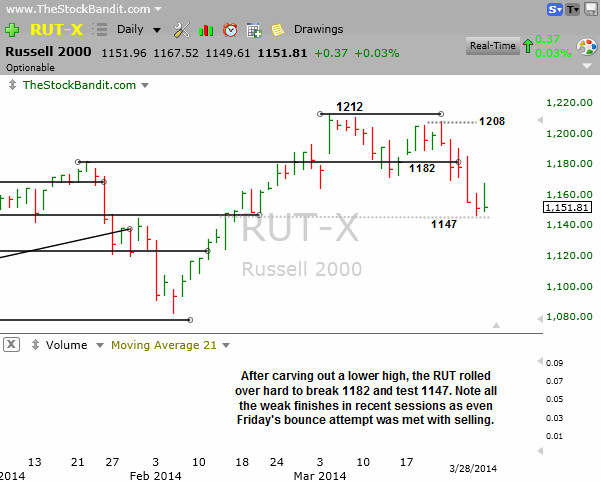
RUT – The RUT has moved quickly lower since failing to clear 1212 on March 21st, and has since broken 1182 support. Last week it returned to 1147, a prior key level listed here numerous times lately. It’s holding it for now and attempting to stabilize, but Friday’s poor finish left it just 2 points off the session low and only 4 points above 1147.
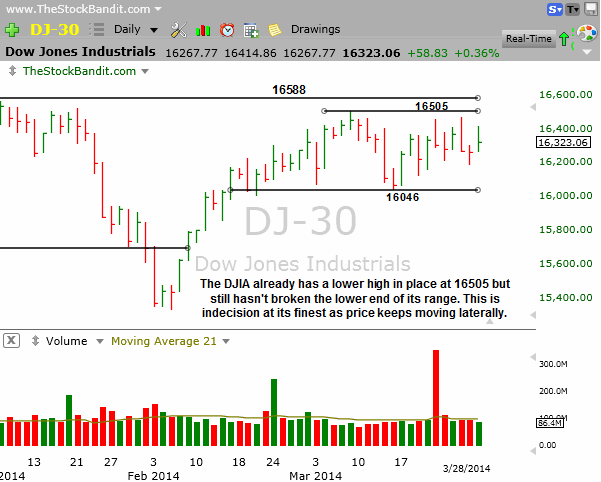
DJIA – The DJIA is simply stagnating here as it moves laterally with no lasting momentum in either direction. This index has a lower high already in place, but has been reluctant to weaken like the others. It’s only 30 stocks, so it’s not as broad of a picture as the other indexes provide, but it is the index which Main Street identifies most readily and for now it’s still only 265 points off its all-time high.
Notable Names:
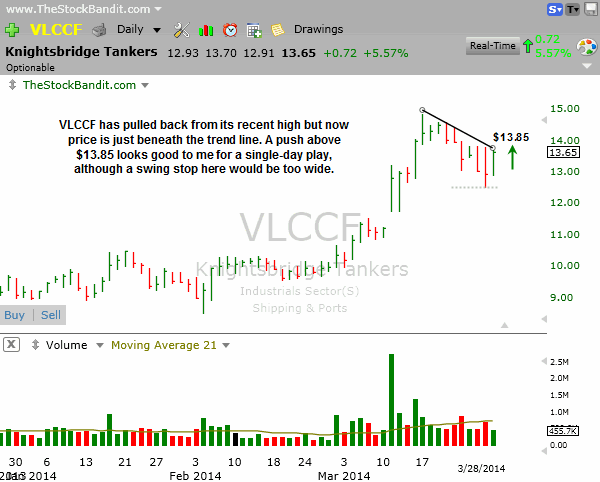
VLCCF is shaping up here for a potential pop but the base is just too sloppy to initiate a swing. I’ll take it for a single-day play on the long side if it can clear the trend line on Monday at $13.85.
PDCE is facing a descending trend line at the upper end of this base and could break out any day. Given the width of the base, I’ll opt for a single-day play here for Monday if price can clear $62.50 to get back on the move.

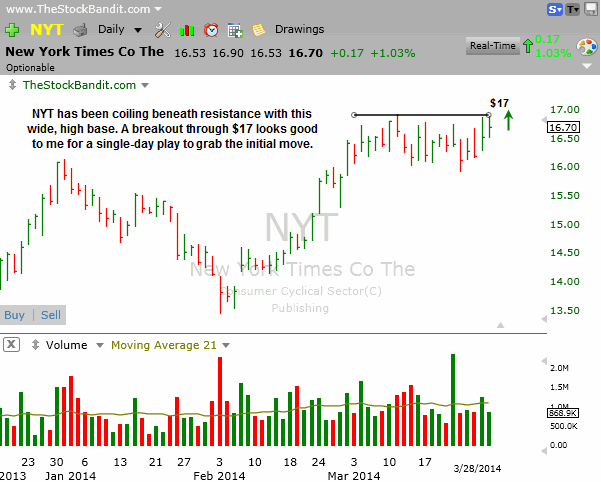
NYT is at upper resistance after creating a loose base in the past several weeks. A breakout at $17 looks good for a quick pop, but given the distance to an appropriate stop I’ll be taking this only for a single-day play rather than an overnight swing.
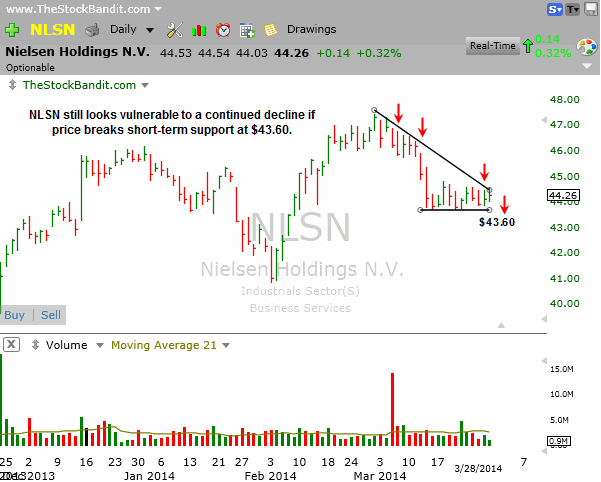
NLSN is still on my radar as the bearish pattern is still in play. A downside break of $43.60 looks good to me for a single-day play on the short side for Monday.
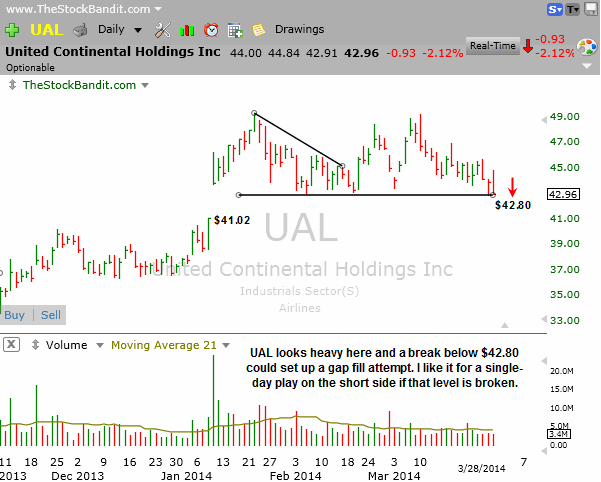
UAL is acting heavy here and leaning on multi-month support. A downside break of $42.80 looks good to me for a single-day play on the short side as it attempts to fill the gap from January.
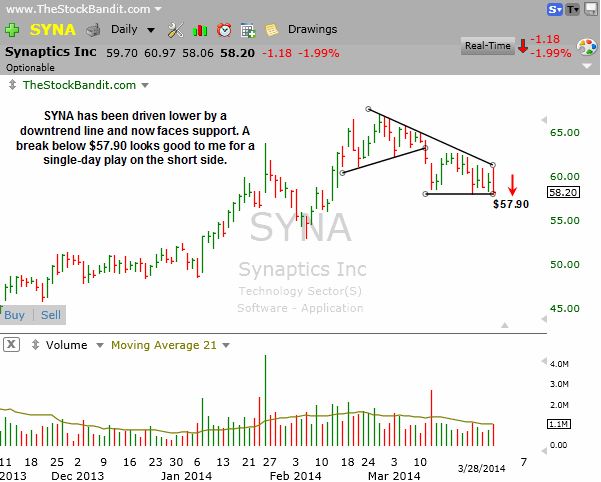
SYNA is at short-term support here and a break below $57.90 looks good for a play on the short side as more selling kicks in. This base is still a bit wide for a swing so I’ll opt for a single-day play if it goes.
New Swing Trade Candidates:
No new swing candidates tonight, still waiting for tighter bases and more mature patterns which carry better risk/reward profiles.
Bullish Watch (click for charts)
Bearish Watch (click for charts)
Trade Like A Bandit!
Jeff


