


Good evening StockBandits!
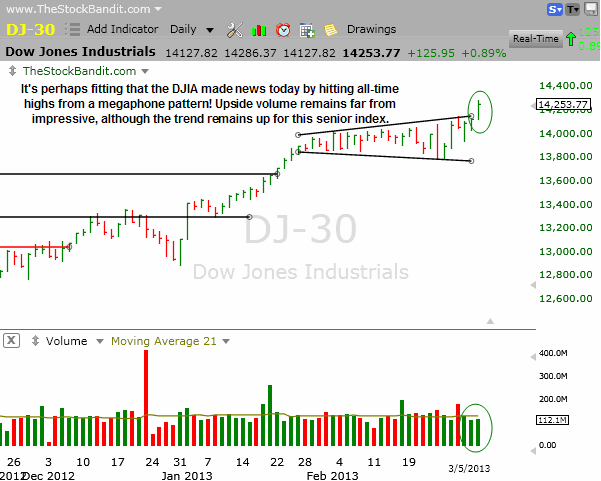
The DJIA finally quit tiptoeing around the topic of making new all-time highs today and went ahead and did it. After several weeks of speculation that the 14198 level from October 2007 would be cleared, it became a reality today with a solid advance of 126 points. Perhaps most fitting about the day on which Main Street sees the news broadcasted everywhere that the Dow hit an all-time high is that it came out of a megaphone pattern – pretty ironic!
Meanwhile, the NAZ and S&P 500 both were able to post breakouts as well – not to new all-time highs, but to new multi-year highs. The RUT has led the way since November but failed to clear its recent high today despite posting its 6th consecutive day in the green. Whether that’s simply a sign of healthy rotation or a warning sign remains to be seen, but it’s certainly notable for now.
Upside volume remains an issue, not only in the indexes but also for many individual stocks. Price is of greatest importance, but it’s undeniable the supporting role which volume plays alongside price. That’s making this breakout less than textbook, so the next few days will be critical if it’s going to hold.
I find it very interesting how many bearish charts are in the mix at the moment. With the indexes still in uptrends and with breakouts taking place almost across the board (RUT), I would expect to see highly lopsided bullish vs. bearish lists. However, there’s a healthy selection of bearish setups and I’m not quite sure what to make of that. Some might wonder if that has any predictive value, and I honestly don’t know the answer to that. I do know that there’s opportunity on the short side as well though, so I’m not averse to playing it alongside long positions. They may come in handy on a pullback, we’ll see.
Let’s get to the charts.
NAZ – The NAZ saw a little better volume with today’s breakout, although it still wasn’t impressive by any stretch. Nonetheless, price did clear the prior high at 3213, so the bulls again have an opportunity to press their edge. If instead follow through is not found, all eyes will be on the gap to Monday’s close at 3182. There is no upside level to keep an eye on as we’re getting into post-bubble territory back in 2000 when emotions were running extremely high.

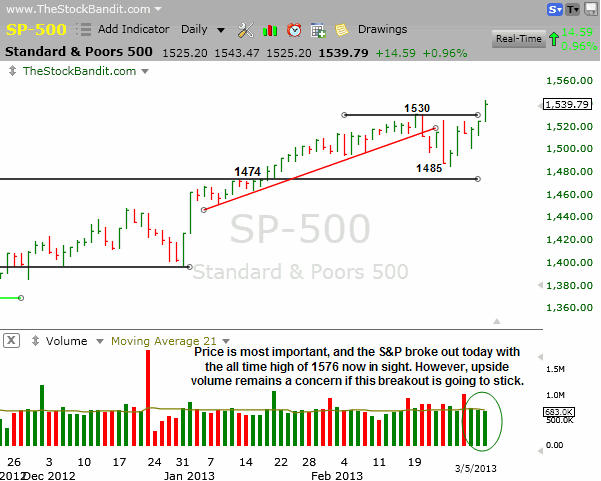
SP500 – The S&P pushed past 1530 today but here again upside volume was nothing special at all. This index has been up 5 of its last 6 sessions, so if a pullback occurs it may threaten this breakout. Otherwise, follow through from here could have this index testing its all time high at 1576 in short order as that’s only about 2% away.
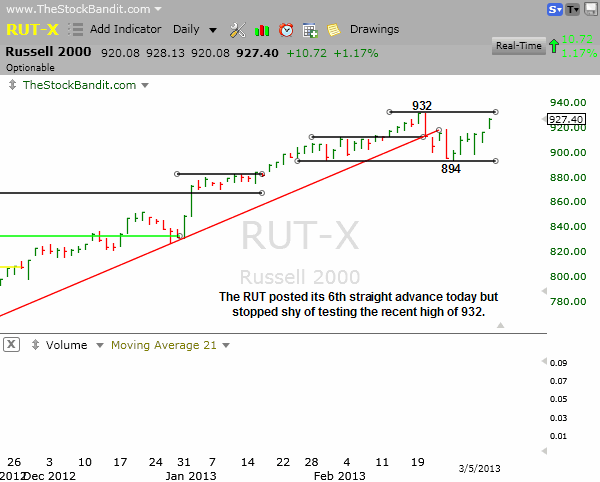
RUT – The RUT posted its 6th straight gain today but still stopped shy of the 932 high. There’s now a small gap to Monday’s close at 916, so any pullback would bring that level to light as the first natural spot to gravitate toward. Otherwise, a breakout puts this small-cap index back at new all-time highs to continue its uptrend after several weeks of lateral price action to digest the Nov – Feb rally.
DJIA – The DJIA left its megaphone pattern to the upside today, negating the bearish implications of that pattern. Fittingly, it made new all-time highs today by clearing 14198. Volume remains light and that makes this breakout a bit suspect, although the trend is still up and that’s not easy to argue with.
Notable Names:
MON is nearing the upper end of its trading range here but stalling out a bit. Today marked its 2nd lower high within the range, which simply points to this one needing more time before a play on the long side can be considered. If it’s able to ease toward the upper end of the channel and then rest, a breakout could project the height of this channel to the $110 area.

WY is also in a channel, albeit a descending channel. It has lifted to test declining resistance at the upper trend line, but volume has diminished along the way. This also suggests more time is needed before a breakout play should be considered.

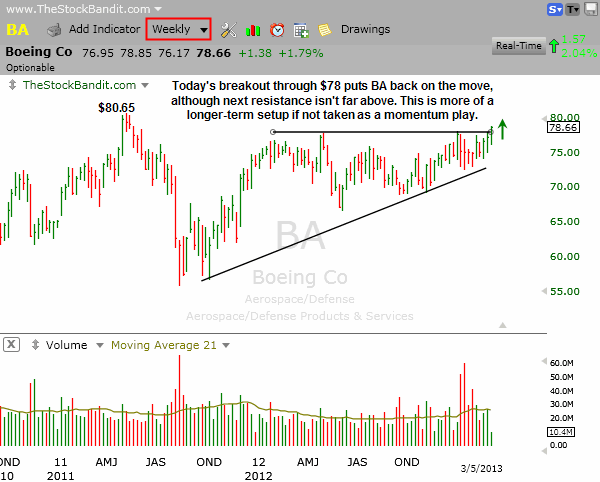
BA cleared multi-month resistance today and this weekly chart shows the importance of today’s push past $78. This slow-moving blue chip stock may be starting an important leg up in the long term, although the next resistance sure isn’t far away.
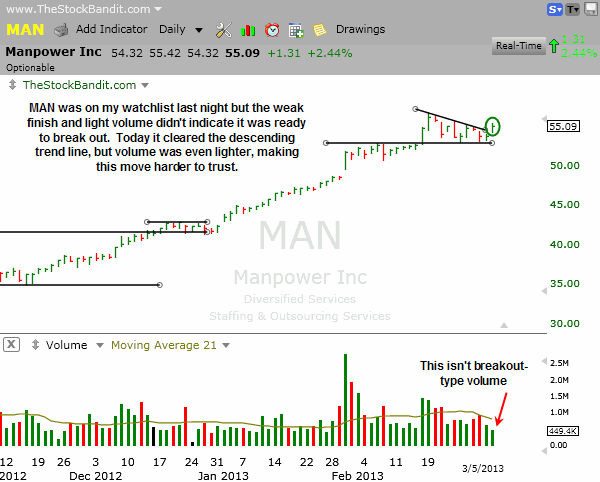
MAN was shaping up last night after pulling back to test and hold prior resistance (turned support), although it looked like it needed a little more time before it was ready to turn up. Today it broke out without me, but did so on very weak volume. It may continue higher, but this initial move doesn’t leave me feeling left behind.
New Swing Trade Candidates:
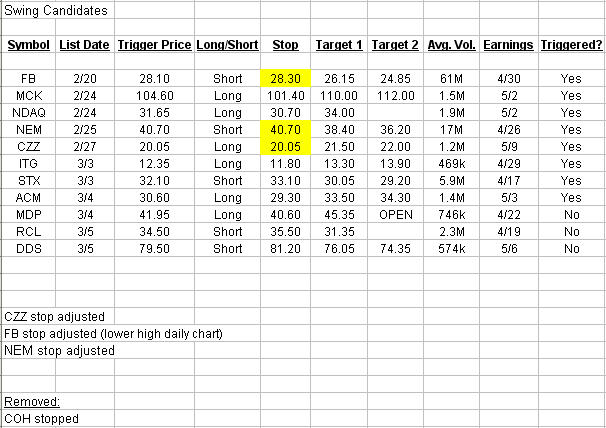
These stocks look ready for imminent multi-day moves. Pattern confirmation occurs with a move through the entry level. Initial stop and target levels are also provided.
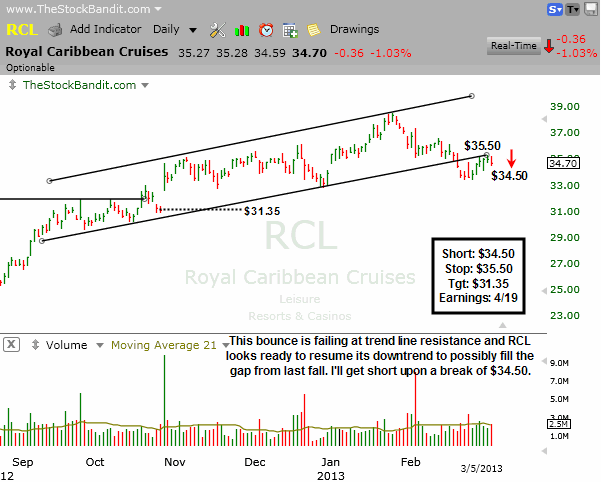
RCL has been on my radar for the past few days after the channel breakdown and a bounce back up to test it. Price stalled out in the last couple of sessions and today started to turn lower despite broad market strength, showing relative weakness. I’m looking to short this stock upon a multi-day low to $34.50, with a stop above the bounce high and a target being a gap fill from last October.
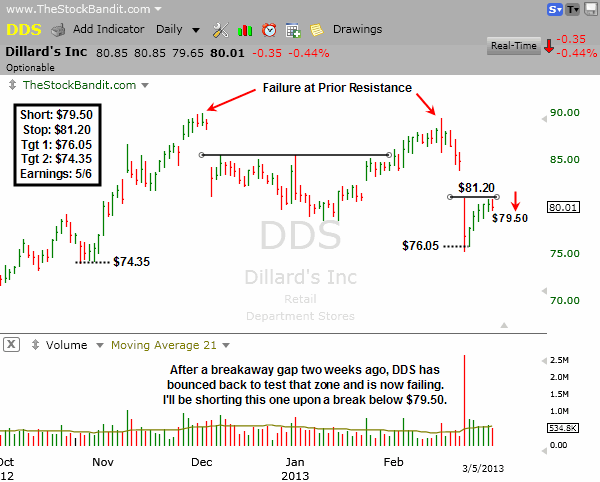
DDS failed at key resistance a few weeks ago, rolled over, and then had a breakaway gap to the downside. In recent days price has bounced back in a V-shaped fashion to test the lower end of that gap, and now it’s beginning to turn lower away from it. I’m looking to short this stock using a protective buy stop above the bounce high with my sights on targets near the recent low and at a prior support zone from last fall.
Bullish Watch (click for charts)
Bearish Watch (click for charts)
Trade Like A Bandit!
Jeff


