


Good evening StockBandits!
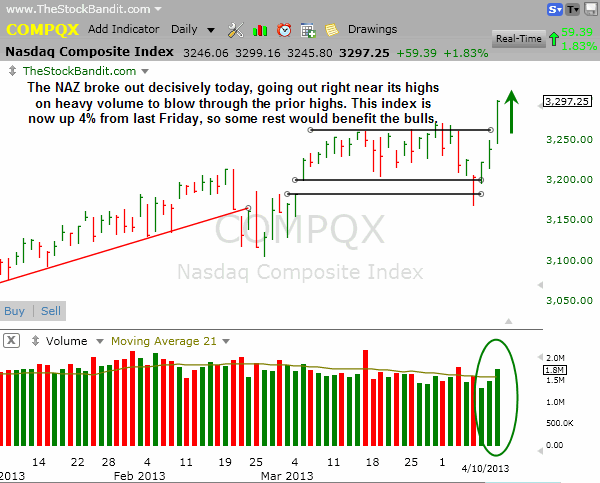
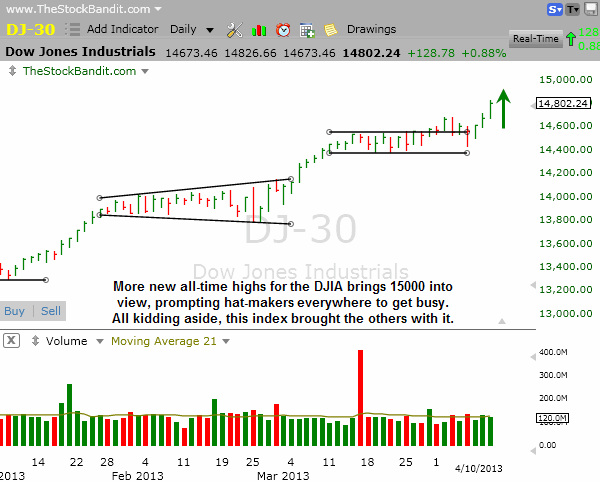
The ramp off last Friday’s low continued today as stocks got bid up aggressively. The push delivered new blue-sky breakouts for both the DJIA and the S&P 500 with each of them reaching new all-time highs. The S&P had in recent days flirted with 1576, the all-time high from 2007, and today it blew through it to get that monkey off the bulls’ back. The NAZ also stretched its legs to lead the way with a 1.83% gain on the session, taking it out the top side of its trading range for a more decisive breakout than we saw on the efforts between 3/28 and 4/2.
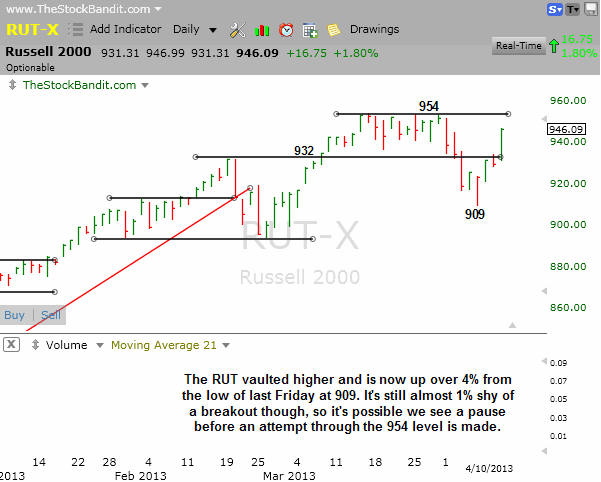
The RUT again stood out as relatively weak, not on the session but overall. For the day, it hardly trailed the NAZ with a 1.8% gain, but going to the daily chart it’s still about 1% shy of its highs at 954. Given that it has lifted 4% in just 4 sessions, it’s becoming a bit more stretched by the day and that may require some rest before a push through the highs is seen.
It’s interesting to me tonight to work through all the charts and recognize that there’s still quite a few stocks which are suffering and correcting. Metals are heavy (no pun intended), and some energy-related names are working lower as well. I think that’s beneficial at this stage to have some go-to names in case of a market decline from here, although the bears would need to bring out every weapon they have to turn today’s breakout into a bull trap.
For now, it seems the uptrends are still fully intact, so the apparent stagnation of the past few weeks has been for the most part (sans RUT) forgotten. The key is to not just locate high-quality plays – which is difficult after a multi-day selloff which resulted in a V-shaped reversal to new highs – but also to time new entries where they stand to benefit from some broad market sympathy. Some rest at this stage would be ideal, although when momentum is running hot it’s hard for the bulls to throttle back.
The overwhelming feeling right now for many is that this market is going one direction and might not ever slow down. The truth is, if this trend is going to continue for a while, there will be more opportunities to get on board. It’s also likely that we’ll see some basing activity or some profit-taking which kicks in to provide a better pivot to trade from, but tonight many of the bullish charts look short-term stretched and therefore not in good spots to get involved.
Let’s get to the charts.
NAZ – The NAZ blew past its recent high today on heavy volume for a very decisive breakout. The only issue for the bulls is that it’s moving at an unsustainable pace, but there is room to pull back for a potential test. Momentum is hot, but this is a hard move to chase.
SP500 – The S&P painted new highs and now has 1600 in its sights. This index has also made a substantial move off the lows from last Friday, but today’s move was very important and very bullish. Follow through at this point now becomes the next focus.

RUT – The RUT made a big move today but still stands shy of breakout territory. The 932 level is back beneath price for now, so we’ll see if this index can now absorb this big 4-day 4% move without giving up that level again. Until new highs are made, there’s potential for a lower high on this bounce that we’ll now need to watch for.
DJIA – The DJIA had another big day today with new all-time highs and now is closing in on 15000 as the next round number. 14000 saw several weeks of churn back in late January, February, and early March.
Notable Names:
AAPL is doing what it needs to do to turn the technical corner here. The low at $419 is still the big level to trade against, but today’s turn up through the descending trend line paves the way for a potential test of the recent high near $470.

NFLX is just churning beneath former support and that may bring another wave of selling for this high flyer. The unfilled gap starts at $139.62, so after seeing this stock fail to clear resistance the tide seems to have shifted.

AMGN is running very hot here and despite new highs and lots of strength lately, this weekly chart shows this move is unprecedented in recent years. The diminishing volume also suggests this move may need to cool off before a better opportunity for entry arrives.

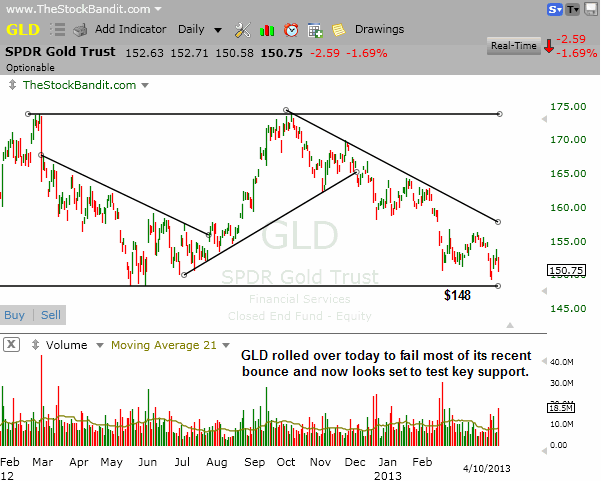
GLD is turning lower again here and we could see a test of the big $148 level any day now. One more day like today and it’s there.
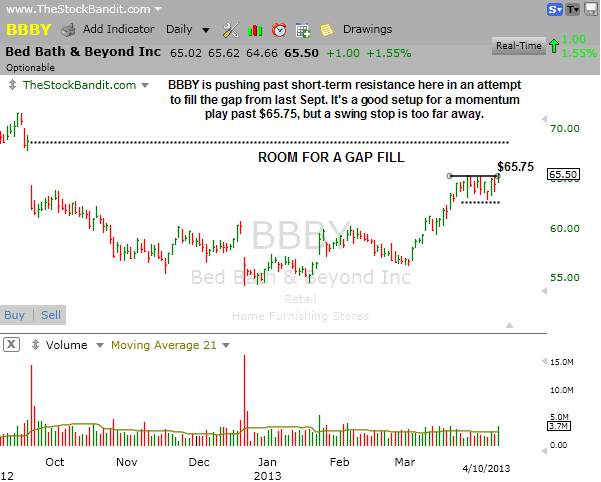
BBBY is a momentum setup for a quick play on the long side here as it starts to fill a gap. A turn up through $65.75 may invite buyers into the picture, although the swing stop is just too far away for me.
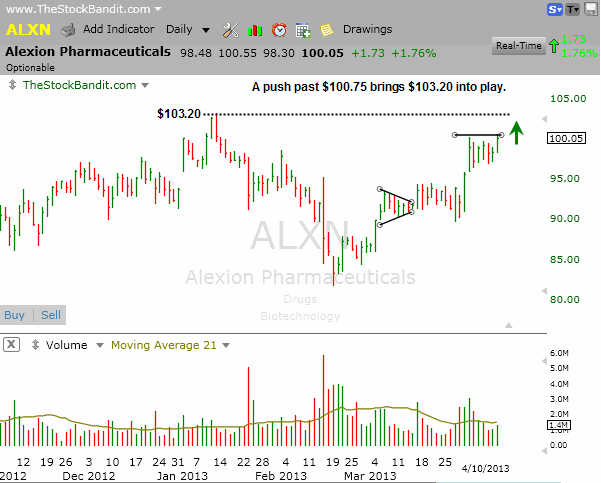
ALXN is a nice setup here and it could pop again if it clears $100.75. However, next resistance isn’t far away ($103.20), so this would be a momentum play only and not a swing for me.
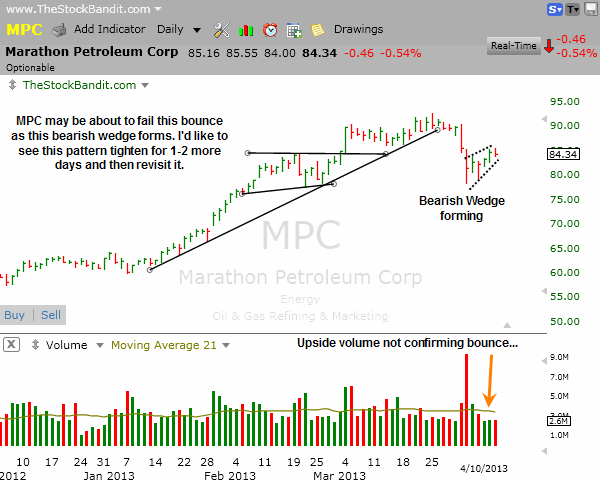
MPC is building a bullish wedge on this weak bounce of the past few days. I’m going to let this base mature a bit more, but the stock looks in danger of creating a lower high which would prove to be a decisive change of trend after the recent hard selloff.
New Swing Trade Candidates:
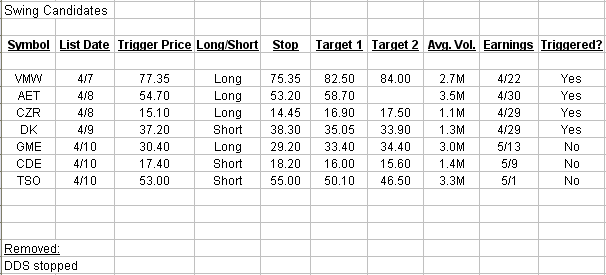
These stocks look ready for imminent multi-day moves. Pattern confirmation occurs with a move through the entry level. Initial stop and target levels are also provided.
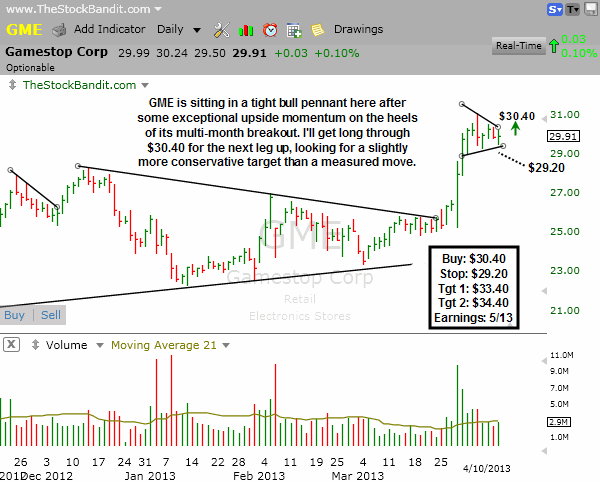
GME is in a tight bull pennant here and today was only up a few cents. This one has shown excellent recent momentum and could play catch-up as a secondary type of stock. I’ll get long through $30.40 for a swing with a stop beneath this base, and will be looking for a move that’s slightly more conservative than the most recent lift out of the large triangle last month.
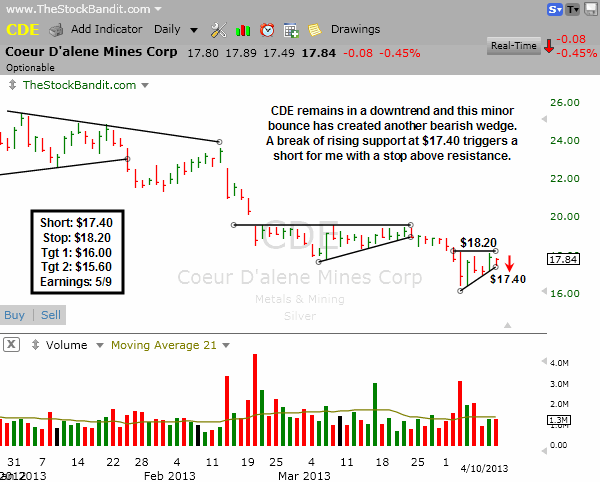
CDE has been trending lower and every bounce and base has been resolved lower. Here it’s carving out another one and I’m looking to short this stock upon a break below $17.40 for a swing. Multi-day resistance isn’t far above, so I’ll utilize that as my stop. Previous breakdowns have carried several points, but I’m looking for a test of $16 and possibly a break before earnings next month if this pattern resolves lower.
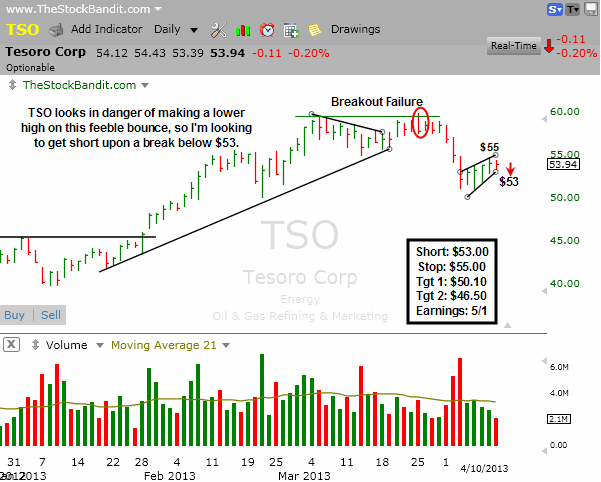
TSO has bounced back quietly in recent days but on light relative volume compared to the hard selloff away from the failed breakout attempt a few weeks ago. This rising wedge has my interest for a short sale, and I’ll look to enter upon a downside break of $53 with a stop at a new bounce high. My first target will be somewhat conservative, but as a second target I’ll be looking for a move back down closer to the gap from late January.
Bullish Watch (click for charts)
Bearish Watch (click for charts)
Trade Like A Bandit!
Jeff


