


Good evening StockBandits!
Following weeks of flirtation with all-time highs, the S&P 500 finally cleared the 1576 high from 2007 last week on Wednesday. The DJIA continued its run toward 15k, while the NAZ left its high-level trading range for the second time in three weeks. The index which failed to clear highs (or even approach them) was the speculative small-cap RUT. That sent some mixed messages to traders, and the big questions now are what does it mean, and who is getting trapped here?
From a technical standpoint, the breakouts we saw last week were impressive. They open the door for the recent multi-week high-level trading ranges to potentially serve as bases for new legs of the rally which began last November. They came on strong volume and even found some follow through. Even on Friday when some weakness kicked in, it proved to be short-lived with a late-day lift which erased the bulk of the day’s already minor decline. None of these things should be ignored.
However, without the participation of the index which has led the way higher for nearly 6 months, it raises some doubts as to the staying power of the breakout. Given the lack of a meaningful correction throughout this run, as well as the prevailing sentiment becoming more negative the higher we go, many at this point are quick to call for a top. That’s a difficult game to play, to say the least. It’s better to keep the prevailing trend in mind and keep looking for opportunities to get on board.
The difficulty with that at the moment is simply that many individual charts are short-term stretched, and therefore very few are in spots where new long-sided entries are prudent. Jumping on the momentum train can be nice until it slows down or stops, at which point the biggest factor becomes where to get off. Chasing extended stocks can at times yield quick and painless gains, but without a downside exit plan, it’s not exactly a good idea.
Toss into the mix the fact that there are still a sizeable number of stocks which are exhibiting weakness or are trending lower (even with the market at highs), and a fair case can be made for playing both sides here. That’s what I’ve been doing, and over the weekend I have 3 longs and 3 shorts currently on. My plan is to continue taking the high-quality setups as they come along, whether bullish or bearish, rather than call for a major turning point like so many others are tempted to do. As long as I’m objectively seeking the best available plays, it should position me appropriately.
Earnings season will be getting underway on a larger scale this week, so be sure to check earnings dates on any stock you’re holding overnight. I prefer to cross-reference the earnings calendars at Yahoo! Finance and EarningsWhispers.
Let’s get to the charts.
NAZ – The NAZ was able to push past the 3263 level for the second time last week, this time holding it. The false breakdown from the prior Friday provided fuel for the rapid lift, and now the NAZ sits at its best levels since November 2000. It needs to hold this move, but it has closed relatively strong in 5 of the past 6 sessions, showing urgency on the part of buyers.

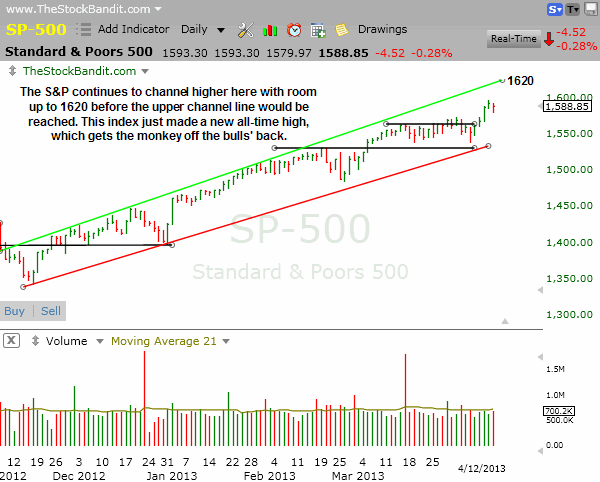
SP500 – The S&P finally made a new all-time high by clearing 1576 last week, and now has room to rally further within this uptrend channel. The upper channel boundary currently sits near 1620 and rises daily.
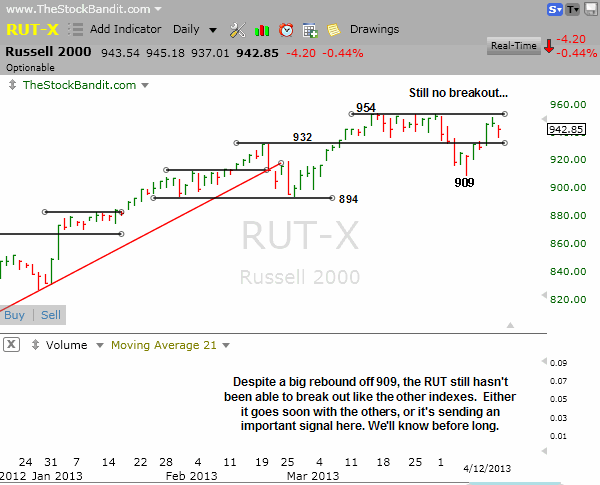
RUT – The RUT remains curiously quiet without a breakout like the others have produced. The 954 level is the one to watch, although for now it’s back in the trading range with potential to carve out a lower high here if the buyers don’t get in gear.
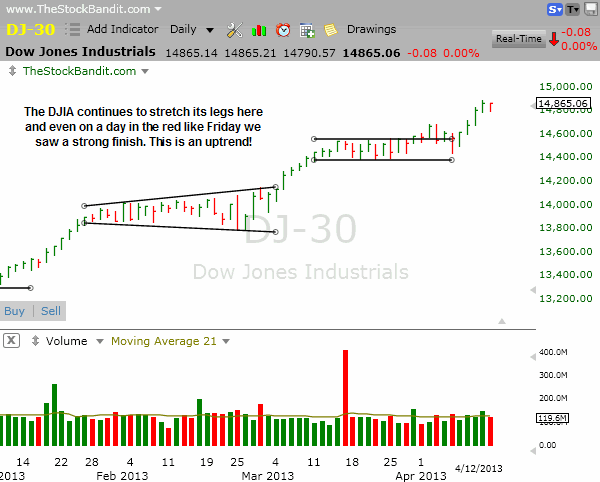
DJIA – The DJIA is on cruise control with new highs being set on 3 different days last week. Friday was a down day, but only by a fraction of a point and with a close right near the high, so buyers are stepping in even on minor weakness at the moment. A rest would be healthy, but with momentum present it’s difficult to expect big downside just yet, barring major news.
Notable Names:
INFI is a great example of a double top. Price recently failed to clear resistance, but then it pulled back to break the reaction low between the two peaks. That break confirmed the double top, and now shifts the momentum to the sellers on any bounce from here.

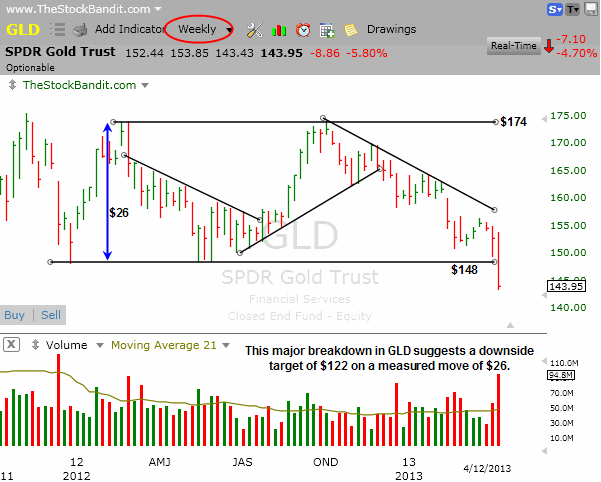
GLD saw a major breakdown on Friday as it easily sliced through $148 support. The trading range on this weekly chart is $26 wide, which projects a move down to $122 ($148 – $26 = $122).
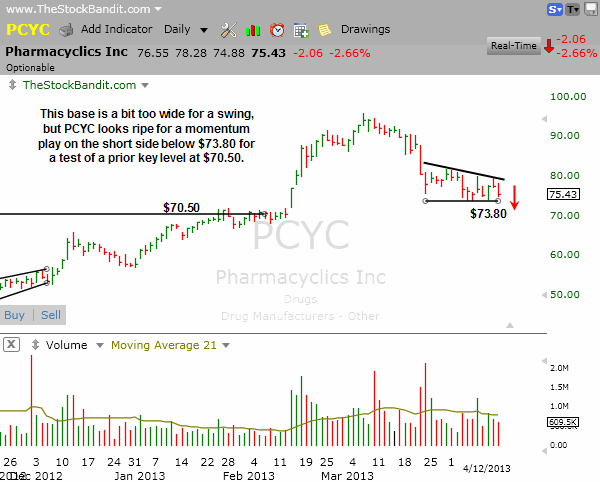
PCYC is building a base here but needs to tighten further before I’ll be interested in a swing. For now, it may offer a momentum play on the short side with a break below $73.80 paving the way for a quick test of the $70.50 level as next support.
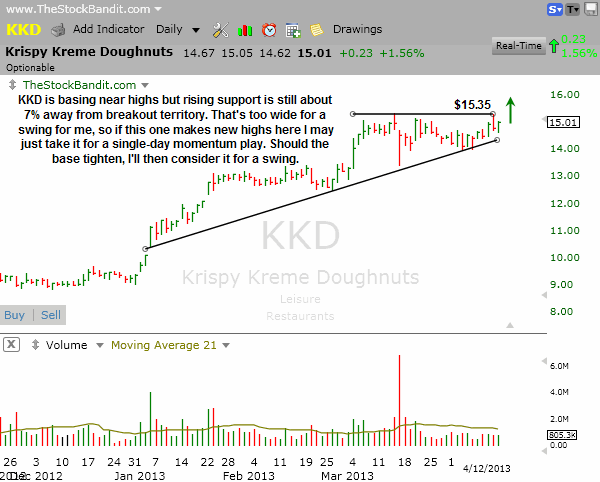
KKD is working higher within its base, which tightens daily due to the rising support and lateral resistance. If this base can tighten further, I’d like it for a swing, but for now an appropriate stop would be some 7% below my entry price. That’s too wide a stop for a swing for me, so I’ll be watching this for Monday as a momentum play should it happen to push through $15.35.
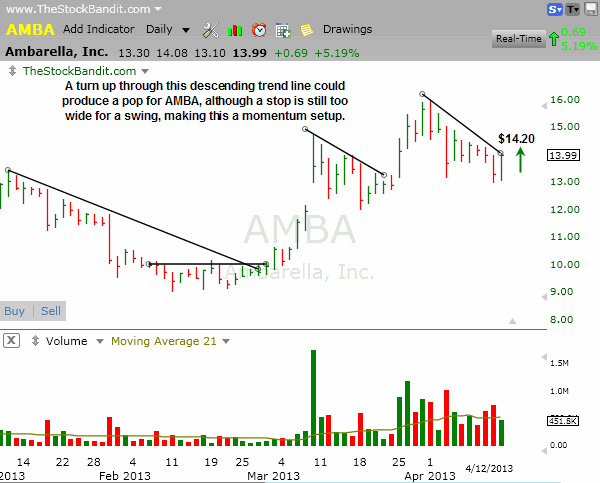
AMBA has pulled back quietly in a similar fashion to the previous pullback in March. A turn up through the trend line at $14.20 could invite buyers into the picture. I like this setup better for a momentum play to catch the initial move than for a swing due to the lack of a close by stop loss.
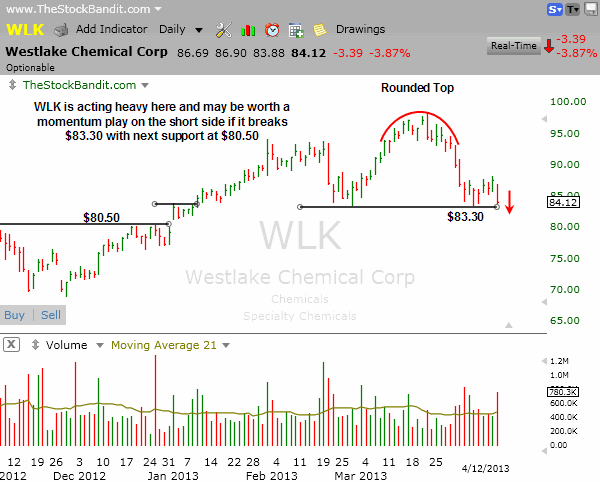
WLK recently rolled over and now is exhibiting an inability to break through multi-week support. A stop is farther away than I’d prefer to be (at a multi-day high), so I’m watching this one for a momentum play on the short side to capture the initial breakdown should it occur. A breach of $83.30 brings $80.50 into the picture as next support.
New Swing Trade Candidates:
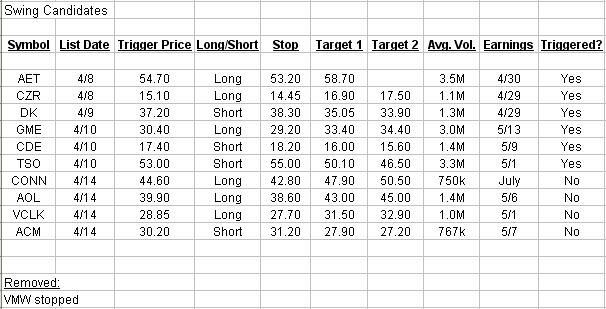
These stocks look ready for imminent multi-day moves. Pattern confirmation occurs with a move through the entry level. Initial stop and target levels are also provided.
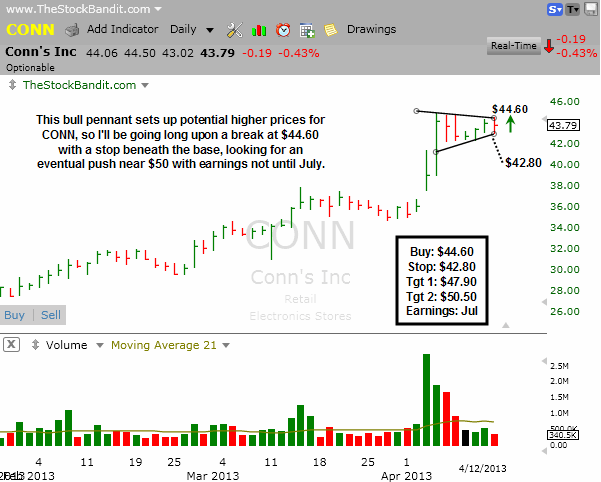
CONN is coiling up here with this bull pennant and could break out any day now. A turn higher through $44.60 triggers a buy for me, and I’ll have a stop just beneath the base. I like how volume has become quiet in recent sessions as it allows for volume expansion to accompany a breakout.
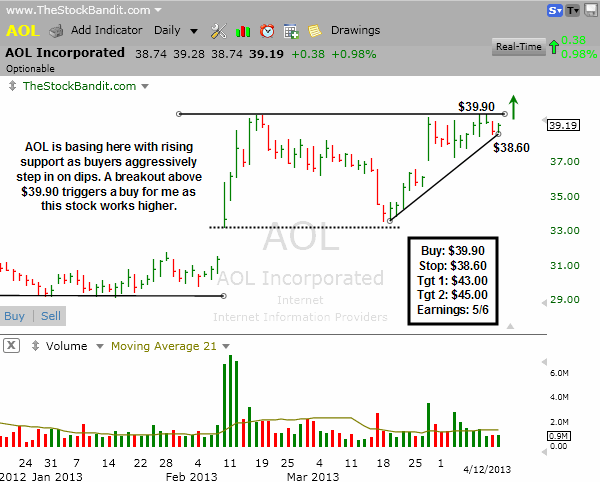
AOL has been caught in a wide range since February but rising support has pushed price up against resistance. A breakout through $39.90 triggers a buy for me with a stop beneath rising support. This trading range is roughly $6 wide, although my final target will be set slightly more conservative than that.
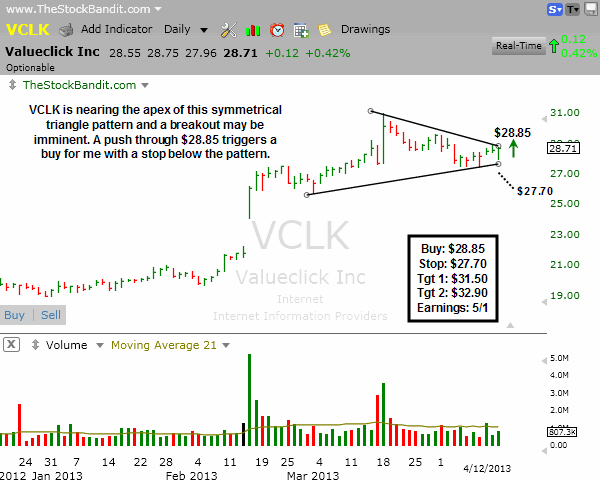
VCLK has reached the apex of this triangle and could break out anytime. A turn up through $28.85 triggers a buy for me as the minor pullback ends and the buyers take control to start a new leg higher.
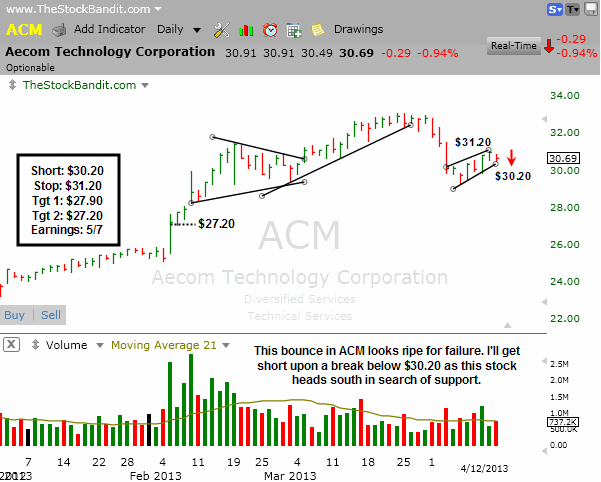
ACM has weakened since mid-March and now this bounce of the past week looks prone to failure. A break below the small rising channel at $30.20 triggers a short sale for me with a stop just above this pattern. I’ll be looking for an eventual test of support from early February.
Bullish Watch (click for charts)
Bearish Watch (click for charts)
Trade Like A Bandit!
Jeff


