Good evening StockBandits!
The indexes saw a 4-day lift in an abbreviated trading week last week to bring stocks up from their recent correction lows. Volume was hit and miss and lower highs are still in place, which should make for an interesting battle in the days and weeks ahead.
The bulls haven’t given up yet and they face a chance here to press this bounce and potentially put an end to the lower highs habit. Should they fail to do that, they’ll seek to produce a higher low on the next pullback. But with the bears having found their groove in the past few weeks, one can be sure they’re going to be gunning for this bounce just like the previous bounces.
The blue-chip averages (S&P 500 and DJIA) continue to exhibit relative strength to the smaller-cap speculative averages (NAZ and RUT), so we’ll pay close attention in the coming days to whether or not that continues or changes. It’s been a reversal-prone environment for 4 weeks though, which has created many V- and inverted-V-shaped moves on the charts for both individual stocks and the indexes alike. That makes for a trading environment which is most conducive to a stick-and-move approach. Toss earnings season into the mix, and it’s a time to pick our spots very carefully. Selectivity can yield great results, it’s just a matter of understanding that there are many immature patterns and bases out there which could stand to build a bit more before they’re ready.
As one last earnings season reminder, keep close tabs on the earnings calendars for the next few weeks especially, as we’re coming into the thick of earnings season. I prefer to use EarningsWhispers and Yahoo! Finance and double-check the listed dates in order to avoid any big surprises. There are others out there, it’s just important to check the date for any stock you’re planning to hold overnight as the quarterly reports start rolling in.
Let’s get to the charts.
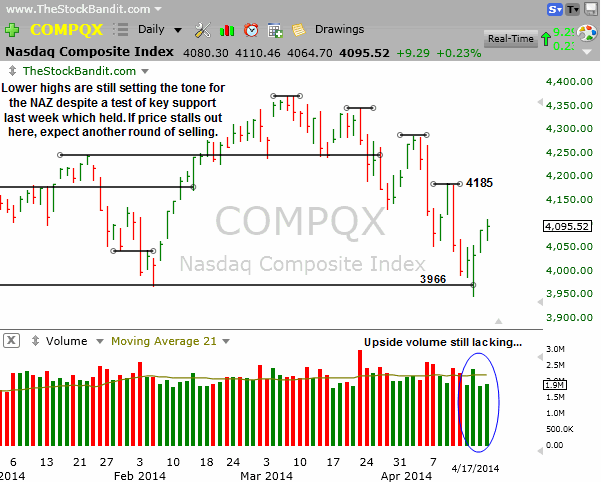
NAZ – The NAZ temporarily broke 3966 last week, but rallied right back to end the week 99 points off Tuesday’s intraday low. The prior bounce high was 4185, so it’s still 90 points shy of breaking the lower-high string which started in March. Note all the V-moves and frequent reversals of the past few weeks on the chart.
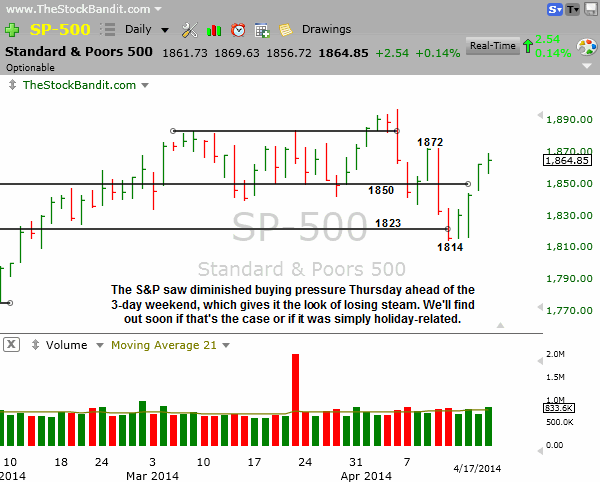
SP500 – The S&P reclaimed 1823 and 1850 last week and got within 3 points of the prior bounce high of 1872 before backing off a bit into Thursday’s close. That leaves it range-bound for now with plenty more to prove.
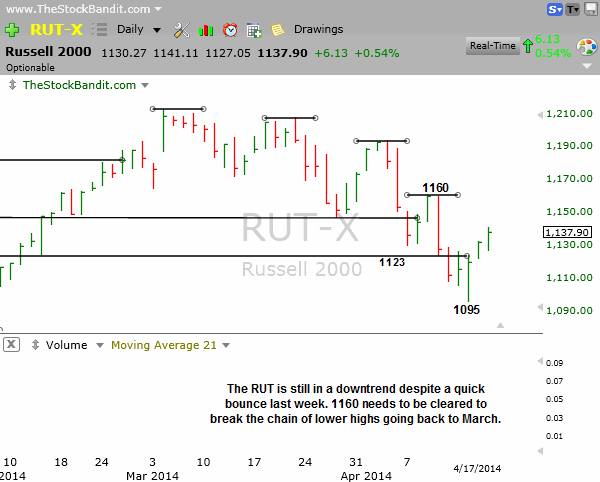
RUT – The RUT snapped back sharply from its Tuesday intraday low of 1095, but still ended the week 23 points shy of the previous bounce high of 1160. The trend here has been clear and it’s down and has not yet changed.
DJIA – The DJIA held 16k on the recent pullback and then snapped back last week to go 3-for-4 on the upside. It’s still shy of the high but off the low, leaving it caught in a wide range as the overall indecision continues.
Notable Names:
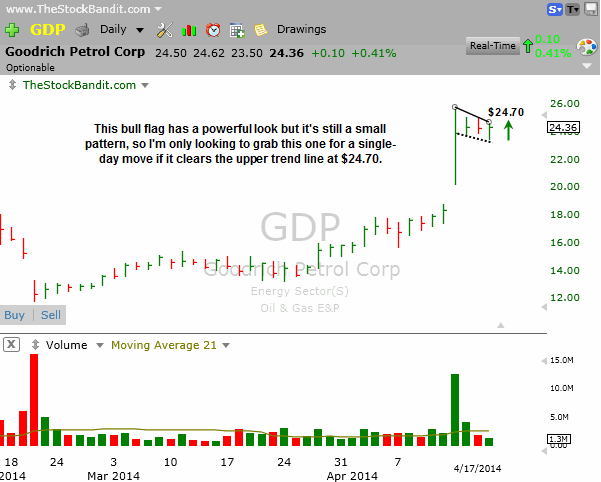
GDP is building a tight bull flag here. While I’d like to see it mature further, the stock has shown recent momentum and simply may not hang around here long. So if it goes on Monday with a break above the upper trend line at $24.70, I’ll opt for a single-day play on the long side to participate in the next thrust higher.
PLUG is a fickle and volatile stock which is nearing the apex of a symmetrical triangle pattern. These compression patterns can produce big moves once resolved, which is why I like them. This being a single-digit stock, I don’t typically trade them but the volume in this one is exceptional so I’ll give it a shot if it goes. I like it for a single-day play on the long side if price clears the upper trend line at $7.55 just to participate in the initial breakout move.
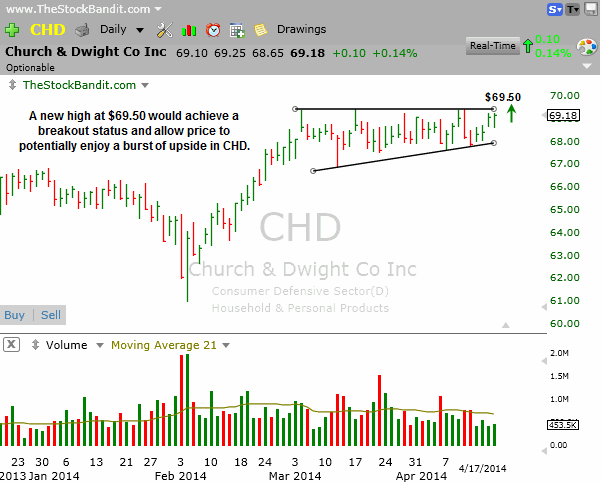
CHD is edging closer to resistance and could break out of this ascending triangle pattern any day now. Upside volume is still lacking though, and the risk/reward for a swing isn’t real appealing at only about 2:1 (if my stop were beneath Thursday’s low and I looked for a $2.50 move out of this pattern due to the height of the triangle). So if price clears $69.50, I’ll take it for a single-day play on the long side for Monday as it leaves this multi-week holding pattern behind.
WFC is hugging rising support and a turn downward through $48.70 looks good for a single-day play on the short side. This could become a lower high compared to the 4/4 peak, which is why I’m most interested in the initial breakdown move.
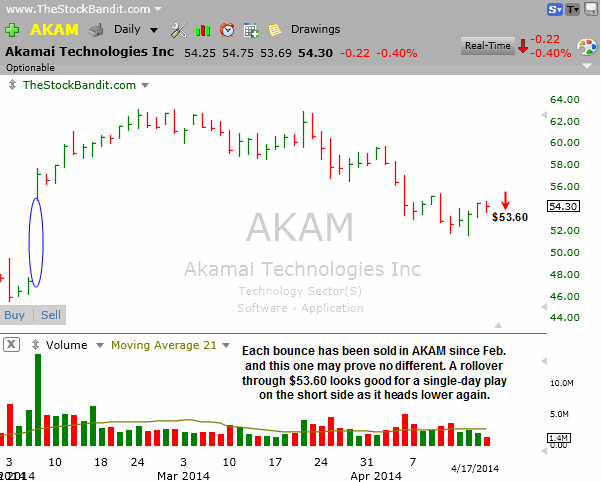
AKAM is already trending lower and looks like it could easily carve out another lower high if price rolls over here. A break below $53.60 looks good to me for a single-day play on the short side as price heads back down to test or break the April low. Beyond that is a partially-filled gap from Feb.
New Swing Trade Candidates:
No new swing candidates tonight.
Bullish Watch (click for charts)
Bearish Watch (click for charts)
Trade Like A Bandit!
Jeff


