


Good evening StockBandits!
Today the new week kicked off with modest gains across the board as the indexes attempted to build on Friday’s advance. Early strength was quickly sold to take the indexes negative until mid-morning when they reversed higher and advanced steadily for the remainder of the day. We saw each of them finish slightly off their session highs, but overall it was a constructive day on the part of the bulls after the morning dip. To see the recoil continue is an encouraging sign for the bulls, but there’s lots more proving to do and the technical damage sustained in recent days isn’t likely to be quickly forgotten.
The RUT again underperformed the NAZ and S&P 500, once more highlighting the relative weakness we’ve seen for several weeks now in small caps. It remains vulnerable to a breakdown through the 894 level in the days ahead, reminding us that the speculative money still seems to have some ongoing concerns regarding the health of the rally.
Overall, the market is currently range-bound here. Although we did see some downside momentum last week, the fact is that zooming out just slightly on the chart reveals a pair of recent levels for each of the indexes as resistance and support, and each of them are caught between them. That means we’re likely to see more indecision, frequent changes of direction, and perhaps even some continued sloppy charts for a little while until a big enough catalyst comes along to propel prices with greater thrust either higher or lower.
For now, it’s a bit of a reactionary environment and traders aren’t highly committed in a single direction. I’m holding a small blend of long and short positions at the moment while waiting patiently for more setups to surface. I’ve found over the years that when great setups aren’t readily available, it’s usually best to exercise some patience and let the charts build further instead of forcing new positions in search of excitement.
Let’s get to the charts.
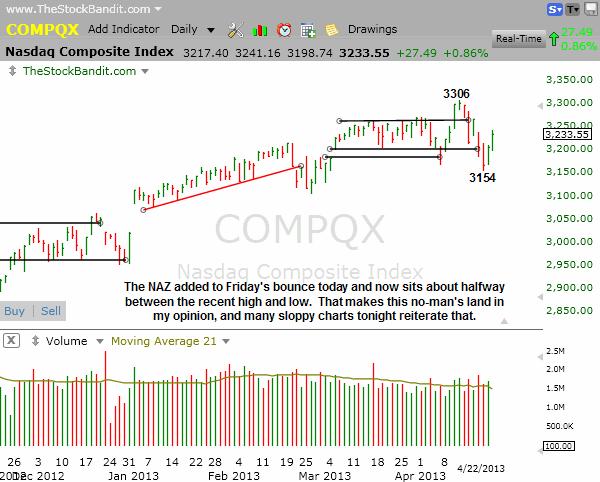
NAZ – The NAZ is still very much range-bound here after a 2-day rebound off the 3154 level seen last Thursday. It’s some 73 points from the high and 79 points from the low, giving it plenty of room to go either way without doing anything meaningful.
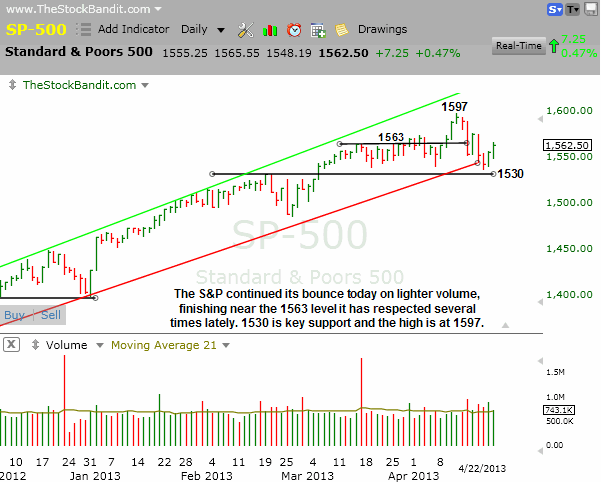
SP500 – The S&P added a few points today but on quieter volume than we saw Friday with options expiration. This blue-chip index remains caught between the two key levels tonight of 1530 support and 1597 resistance.
RUT – The RUT added two points today after testing the 900 area yet again this morning. That shows that bulls are defending that area above 894 key support, but it’s still a long way back to the highs at 954 from current levels, particularly after a lower high and a lower low.

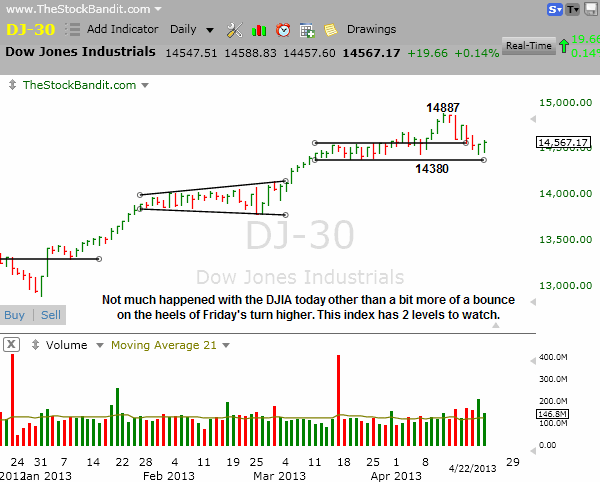
DJIA – The DJIA currently sits less than 200 points above multi-week support, which doesn’t give it a lot of breathing room here. Today it was up slightly but still stands some 320 points shy of its recent high.
Notable Names:
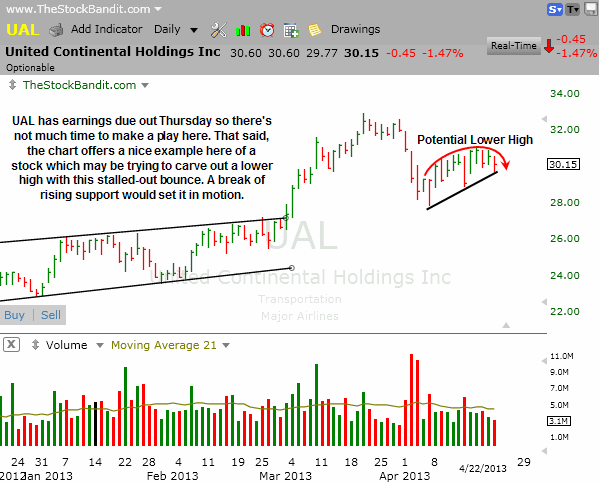
UAL is set to report earnings in just a few days but this chart offers a nice example of what a possible lower-high-in-the-making looks like. The bounce has stalled out and now price is beginning to roll over a bit, well shy of the prior high set last month. A break of rising support would be the indication that the bounce is beginning to actually fail.
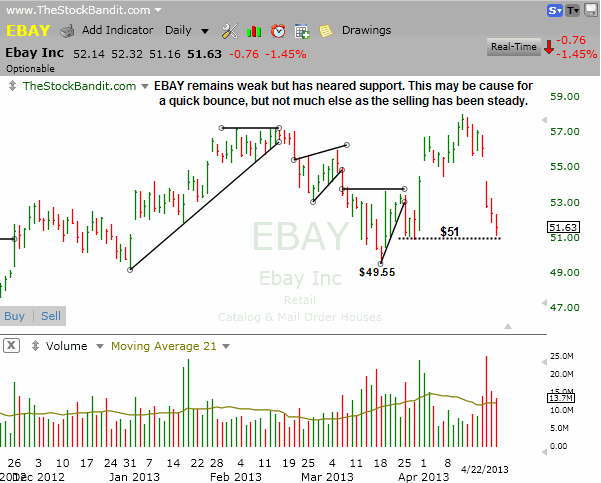
EBAY is getting a bit stretched here on the downside after being down 6 of the past 7 sessions. Here it has reached some short-term support, which may give it a temporary bounce, but this is far from a bullish chart.
LULU is a nice example tonight of not fighting a stock once it gets through a key level. For this stock, $66 has on numerous occasions provided support or resistance for this stock for more than a year. Two weeks ago, it closed above that level and hasn’t surrendered it. Anytime you’re able to identify a key level, expect it to serve as support if it’s beneath price and resistance if it’s above. That can prevent a lot of pain and frustration that shorts in this stock are currently feeling!

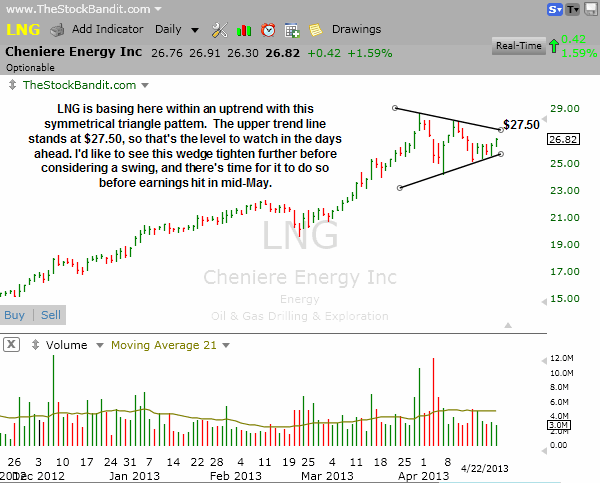
LNG is building a nice base here as it rests within its uptrend. I’d like to see this narrowing consolidation tighten a bit further and then consider it for a swing if it can happen in the next few days.
WSTC is set to report earnings on Thursday so there isn’t time to set up a swing. The problem with that is that I’d be taking the full risk without much time available for the stock to make a move large enough to much more than offset the risk I’m taking. Instead, I like this setup for a momentum play on the initial move up through $20.85.

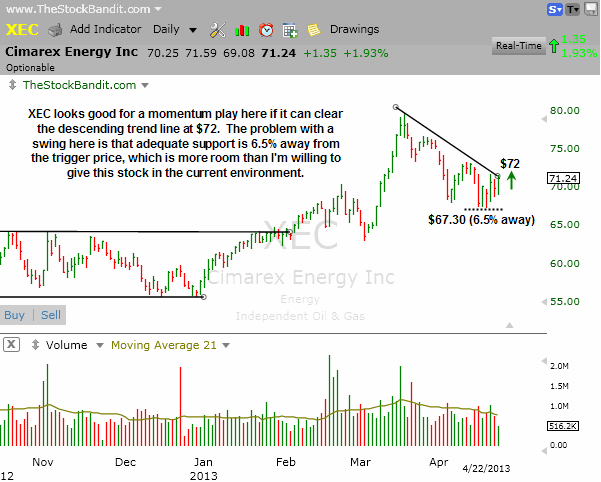
XEC is challenging a trend line tonight and a turn up through $72 opens the door for a quick pop. I like this much more for the momentum play than a swing, as a swing stop would be some 6.5% away.
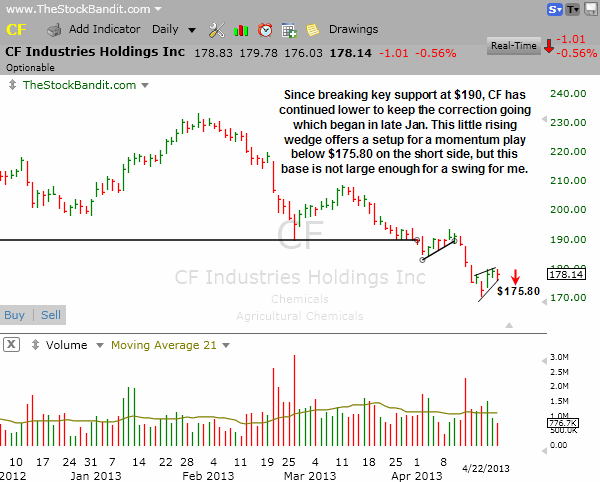
CF is working on a small rising wedge here and if it can develop further, it may offer a swing setup. For now, I’d only be interested in a momentum play on the short side if the small rising support trend line gets broken at $175.80.
New Swing Trade Candidates:
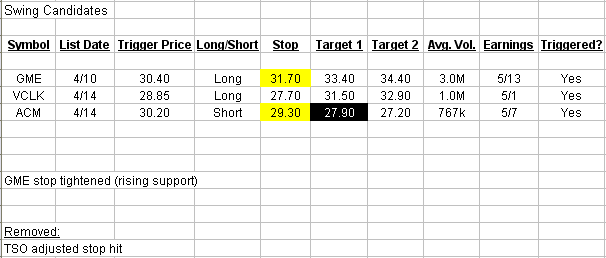
No new swing candidates tonight, waiting for charts to develop further before committing more capital on an overnight basis.
Bullish Watch (click for charts)
Bearish Watch (click for charts)
Trade Like A Bandit!
Jeff


