


Happy Mother’s Day StockBandits!
On Friday we saw the S&P and Dow each close just a short distance from where they finished the previous week. The S&P really typified the week with 5 bars on the daily chart of alternating colors: green/red/green/red/green. Both of these senior indexes are once again facing key resistance with the potential for meaningful breakouts (believe it or not!).
The NAZ and RUT each lost some ground on the week. Friday’s bounce from the lows gave the impression that perhaps the buyers are becoming interested, but we saw similar action on Wednesday without any upside follow through. We’ll see if either can exhibit any additional strength early this next week. Both are still well shy of key resistance zones, having been unable to maintain a bid for more than a few hours.
You can almost hear a collective “what to do….whaaat to do…” out there right now. Traders are observing the relative weakness in the NAZ/RUT vs. SP500/DJIA and waiting to see which side will pull the other side along. They’re also watching the indecision of the blue chip averages as they have had virtually a daily opportunity to break out yet have repeatedly failed to seize any of those chances. Instead, price just keeps hem-hawing around like a non-committed car shopper who keeps kicking the tires but won’t go inside to ink a deal, completely on the fence. Make it stop, already!
I was a bit surprised this weekend at the shrinkage of my watchlists on both the bullish and bearish sides. While the market indecision has been pretty brutal, my lists were considerably longer even Wednesday evening. I don’t have anything in particular to attribute the reduction in candidates, other than sloppy daily charts with the back and forth price action. We’ll eventually get some better momentum and emotion, but right now this market is still badly in need of a catalyst.
Let’s get to the charts.
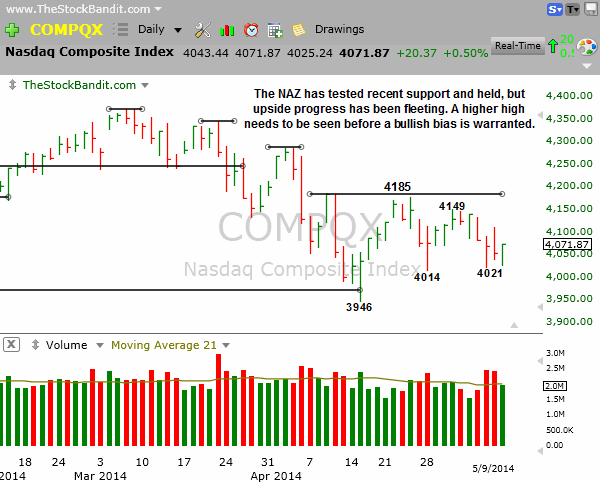
NAZ – The NAZ keeps painting lower highs but has also established a pair of short-term higher lows. That sets up an interesting situation here where we need to now be watching for increased momentum and the creation of a higher high on the way up or an all-out breakdown to interrupt the cycle of indecision. Friday’s bounce was limited and didn’t come with big volume or clear Thursday’s high, making it difficult to assign much importance to it.
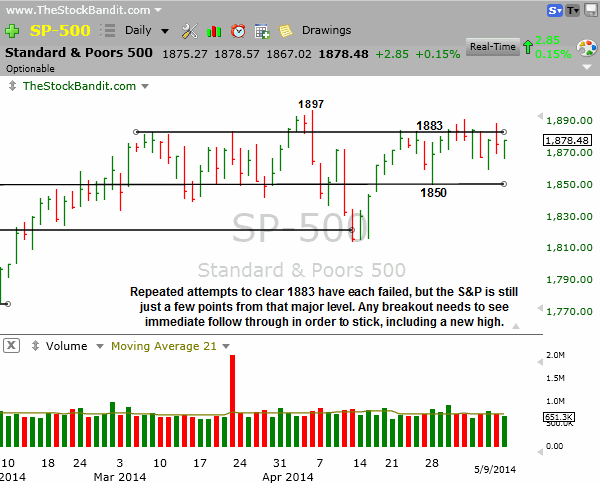
SP500 – The S&P ended the week just 5 points from the all-important 1883 level, so once again we’ll see if it can break this alternating-bars cycle from the past 5 sessions and actually show some follow through. If it does clear resistance, I’ll want to see if (1) it holds, (2) it shows some follow through, and (3) it makes a new high by clearing 1897. Friday’s lift here also came on weak volume, so we’ve yet to see a meaningful shift in this index.
RUT – The RUT neared major support last week and saw a bounce on Friday, but it still ended well shy of Thursday’s high and some 30 points from the previous bounce high. The string of lower highs needs to break before we can expect any meaningful bullish shift, so I’ll be watching the 1137 level along with 1079 as we head into this week.

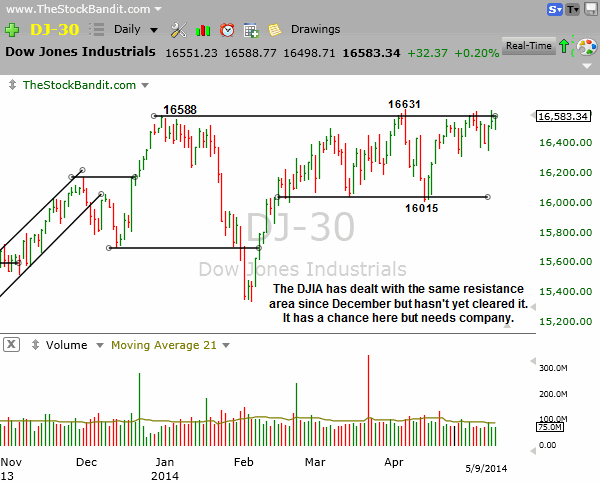
DJIA – The DJIA keeps dealing with the same resistance from December despite a couple of attempts to clear it even last week. It has a chance here once again, so we’ll see if it can make it happen or if instead it retreats back into the range. An upside breakout could bring a 550-point measured move out of this trading range, which would be the sort of momentum we’ve been waiting for this market to exhibit. That’s unlikely to happen without the help of the S&P 500, and some sympathy strength in the NAZ and RUT as well.
Notable Names:
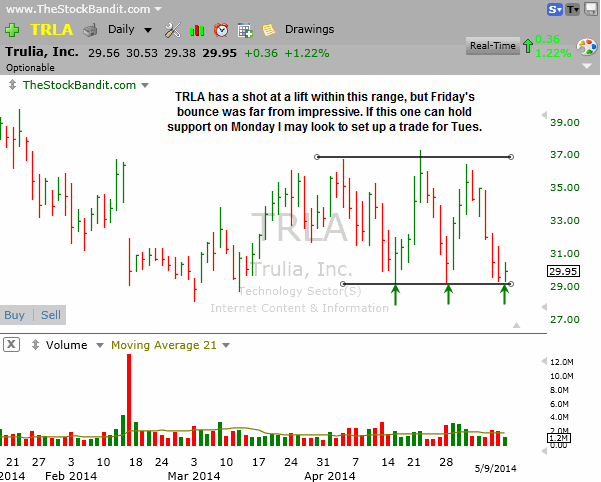
TRLA is at the lower end of its range and may soon benefit from a bounce in the NAZ if support is able to hold. Friday’s lift was mediocre, however, so I’m leaving it on the radar for now. I’d like to see a bit more time above support but may then look to set up a play on the long side looking for a lift within the range.
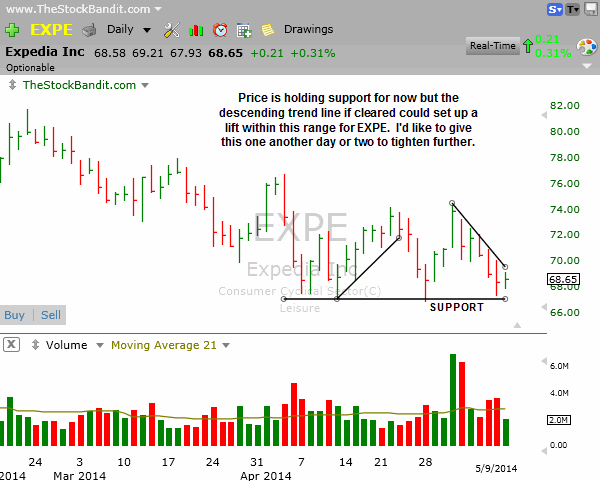
EXPE has again held support and has a shot at a rally back up toward recent resistance if it can get through the descending trend line. I’d like to see this pattern tighten just a bit more though, after which I think it would look better for a swing on the long side. A downside break of support would negate this pattern.
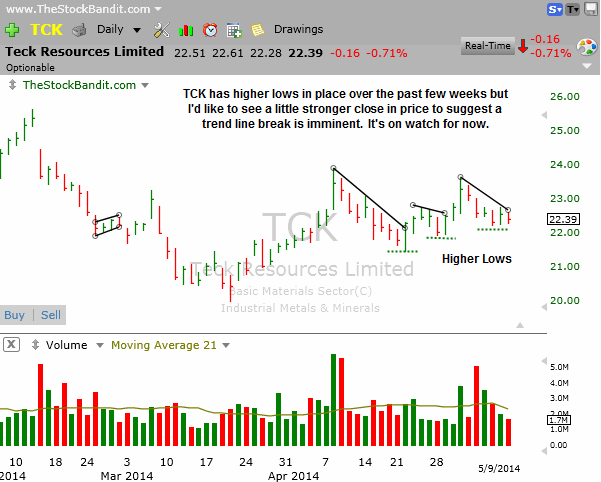
TCK is also on my radar tonight but I’d like to see price exhibit a little more strength before setting up a trade. I’m watching the higher lows which have developed, but want to see price pressuring the descending trend line more than it is tonight.
FCX is attempting to stabilize here after a short-term pullback and a turn up through the trend line at $34.05 could spark a quick lift. There’s still some overhead not far away, which is why I like this better for a single-day move than for a swing.

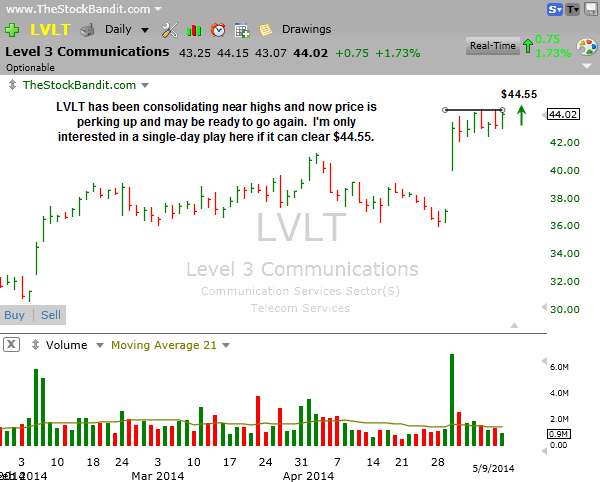
LVLT is at resistance here and my be ready to punch through. A new high at $44.55 looks good to me for a single-day breakout play, although I’m just not interested in a swing here as a breakout play given the indecision we’ve seen in the broad market, as generally those work better under market conditions with better momentum than what we have.
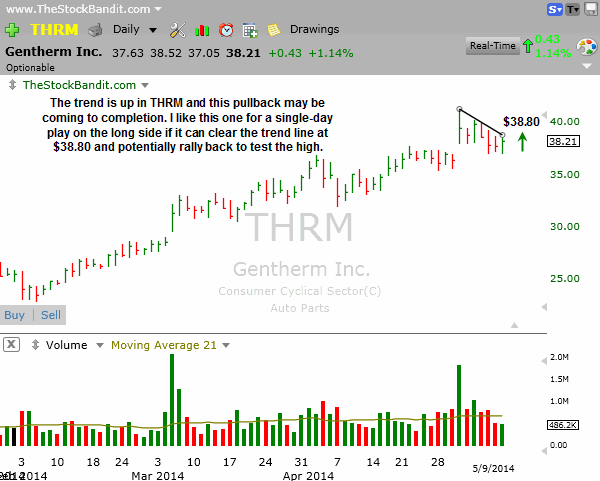
THRM is trying to turn back up after a short-term pullback and is now facing the descending trend line. A push through $38.80 looks good to me for a single-day play on the long side, perhaps with a move back to test the recent high.
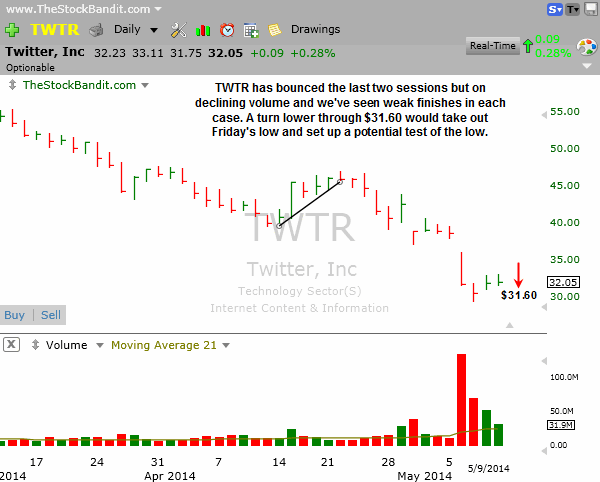
TWTR has been crushed in the past few months but still may have some downside. The bounce last week was feeble, so any turn down from here looks good to me for a single-day play on the short side under $31.60.
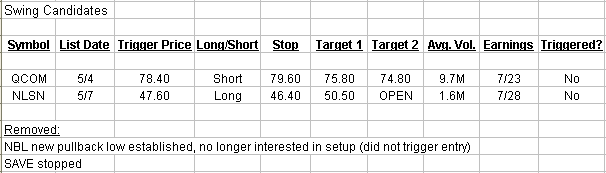
New Swing Trade Candidates:
Sticking with existing candidates heading into Monday while waiting for new patterns to emerge.
Bullish Watch (click for charts)
Bearish Watch (click for charts)
Trade Like A Bandit!
Jeff


