


Good evening StockBandits!
Just when it looked like the trading ranges would persist yet again, Friday’s jobs report produced a massive gap higher to create breakouts in every index, shattering the hopes of bears who were looking for a retreat from resistance. Even the RUT (which had lagged since Easter week and since then had created a pair of lower highs) was able to paint new highs on its daily chart, leaving the bears completely stunned.
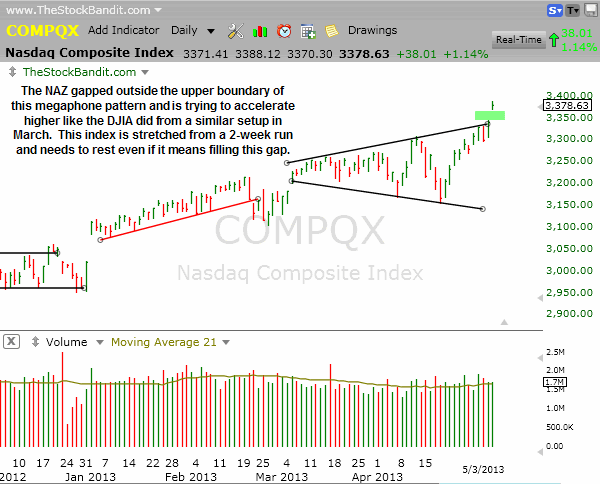
The ramp off the mid-April low was quick and impressive, and volume didn’t really confirm it. That left the market somewhat stretched as it came into key resistance areas, setting the stage for some predictable profit-taking. On Wednesday we got a pullback – the start of that predictable selling, but then no follow through. Thursday saw strength across the board and then Friday crushed the shorts as resistance got cleared in every index. The NAZ was able to accelerate higher out of its expanding triangle (megaphone) pattern, much like we saw the DJIA do back in March.
At this stage, it’s a very tricky situation. Momentum is running hot and we’re just now breaking out. That’s certainly bullish if it can hold. Measured moves out of the trading ranges could produce plenty more upside in the near term, but the issue right now is one of risk management. We’ve had plenty of 2-way price action in recent weeks, and there’s a possibility it continues.
Aiming to get long after this breakout also means buying after advances of up to 7% (NAZ) in just 11 trading sessions. Not only is that an unsustainable pace, but the V-shaped liftoff over the past 2 weeks also means little to no basing action. That translates into no well-defined downside exit (stop), which is never a good trading plan. I would expect to see the next dip get bought by both bulls and bears alike (putting cash to work & covering shorts, respectively) but that’s what we need to see at this stage to set up some better trading opportunities.
Tonight there are many stocks reaching higher and late last week you could almost have bought your initials and be sitting on a winner here. But now the proverbial rubber band is stretched, and chasing the move almost never ends well if poorly timed due to the lack of a downside exit strategy. It’s best to wait for that pullback to come – and it will – before becoming aggressive with new buys.
Let’s get to the charts.
NAZ – The NAZ is very stretched after lifting more than 7% off the mid-April low but is still accelerating higher here out of the megaphone pattern. This pattern is often bearish unless price can rally beyond it to negate it, much like we saw in the DJIA back in March. The jury’s still out as to whether this will hold, although it’s not a move I’m eager to fight.
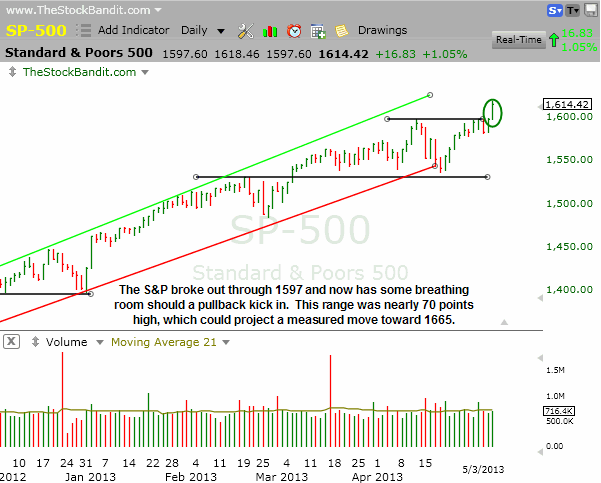
SP500 – The S&P broke out Friday through 1597 after just a couple of days worth of rest. This index has made a big move over the past 11 sessions, advancing in 9 of them. It’s due a rest after that run, but bigger picture has a potential measured move of nearly 70 points out of the 1530-1597 trading range.
RUT – The RUT finished right at 954 on Friday, which was the prior high. It did make a new all-time high intraday, but seems stretched here in the short term even after a big pullback last Wednesday. If a breakout can stick, it would project a move toward 1015 (60-point trading range added to breakout zone).

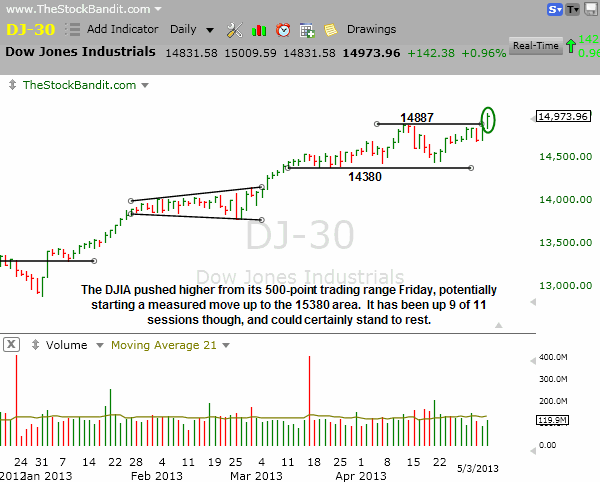
DJIA – The DJIA left its 500-point trading range in the rearview mirror on Friday, but will now need to hold the breakout if a measured move is going to occur. This is a good start, although the price action in the other averages will have great influence on this one. Nonetheless, Main Street will be discussing Dow 15,000 over the weekend after seeing this index clear that level briefly on Friday.
Notable Names:
GS bounced Thursday and Friday, but still didn’t even reach the upper end of its descending channel. The lack of leadership in financials is surprising given that the S&P is at new all-time highs.

TLT turned sharply lower on Friday after challenging key resistance in the last couple of weeks. This is the first time we’ve seen money coming out of bonds and into stocks simultaneously in nearly a month.

FCX is still in a downtrend but just bounced. Interestingly, price lifted enough Friday to fill the gap from mid-April and then backed off for the remainder of the session, finishing at its lows. The gap from Friday morning is now subject to being filled next. Rising support is coming into view but isn’t being threatened just yet.

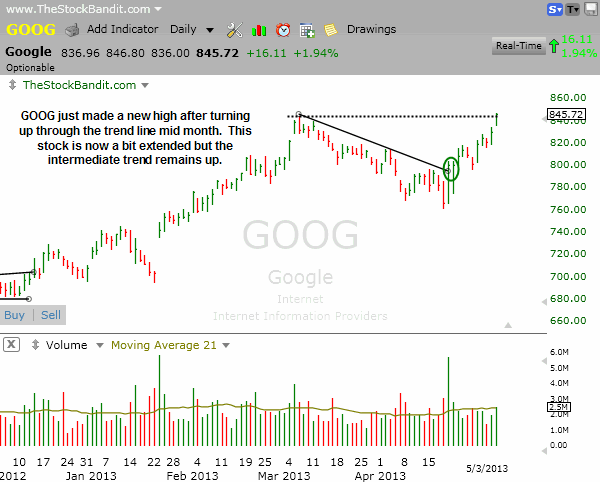
GOOG just tacked on 11% from its April pullback low to achieve a new high. The trend line break which occurred on 4/19 was tested a few days later but held, and this tech giant remains poised for additional gains once it’s able to base and rest to digest this move.
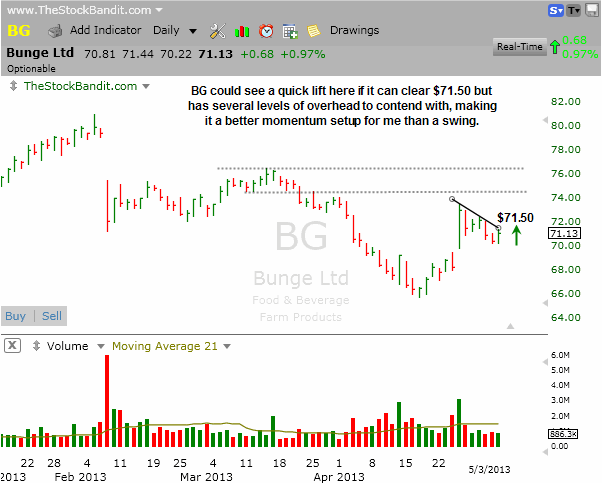
BG is pulling back here and sitting just beneath a small descending trend line. A turn higher through $71.50 sets up a momentum play on the long side, although as a swing there’s just too much overhead to contend with for my preference.
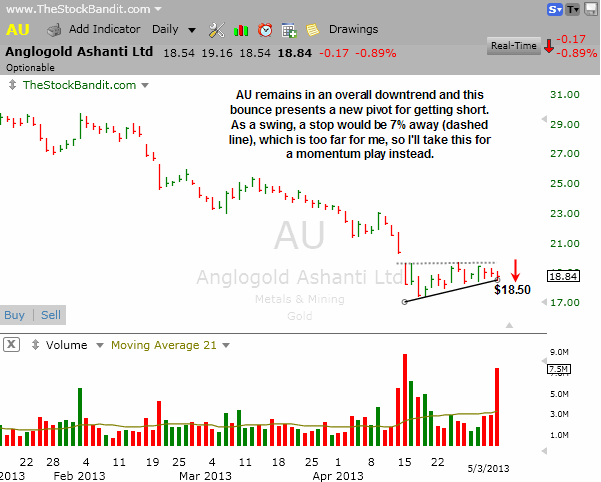
AU has bounced slightly and more than anything rested in the past couple of weeks. Price is now resting on rising support, and a break below it sets up another wave of selling for this stock to continue its downtrend. I like this best as a momentum play below $18.50, as a swing stop would be in the $19.80 area which is 7% above the technical sell level and too much room to give this stock in my opinion. Instead, I’ll just look to grab the initial break from here and then stand aside.
New Swing Trade Candidates:
No new swing candidates tonight, waiting for better entries. Following the 2-day market rip higher, very few stocks are in position for new buys. Furthermore, bearish charts have seen some relief but may not be done bouncing yet. As such, this is a time to be patient so that’s what I’m doing.
Bullish Watch (click for charts)
Bearish Watch (click for charts)

Trade Like A Bandit!
Jeff


