


Good evening StockBandits!
Following a shaky start this morning, stocks reversed from their lows 10 minutes into the session and rallied without hesitation into mid-day. From there, the action leveled off for a while. In the final 2 hours though, another round of profit-taking kicked in to back the market down well off its highs, only to ramp right back and make new highs for the session. Needless to say, it was not a quiet day by any stretch of the imagination!
The current rally is certainly getting long in the tooth, and I’ve noted in recent reports that prices have not only carried a great distance in a short time but that the pace of this move is becoming unsustainable due to the lack of profit-taking and rest. Today’s intraday spikes felt somewhat “squeezy” and that raises the question of whether the current run is finally starting to exhibit signs of fatigue. I would expect that at some point soon we see some longer-lasting selling than the pair of 30-minute declines we got today, which should really help in terms of setting up new plays going forward.
This is proving to be a very buoyant market, largely due to some widespread underperformance anxiety. That’s prompting bulls to chase prices in expectation of continuation, and it’s keeping bears defensively covering even into the smallest of intraday dips just to alleviate their pain. The result is that both sides are propping up prices but nobody seems happy!
Let’s get to the charts.
NAZ – The NAZ went red for just a few minutes this morning but then got right back to keeping the 3-week bounce alive. It’s now up over 8% on this lift and very extended. Some profit-taking will arrive, it’s just a matter of time and it becomes more likely by the day. This move has left many stocks looking bullish yet not buyable due to the lack of basing action we’ve seen.

SP500 – The S&P has also been extremely persistent in this rally, which validates the breakout we saw last week through 1597 as new highs were made. There’s now more than 2% of breathing room down to that level, although no profit-taking has started yet.
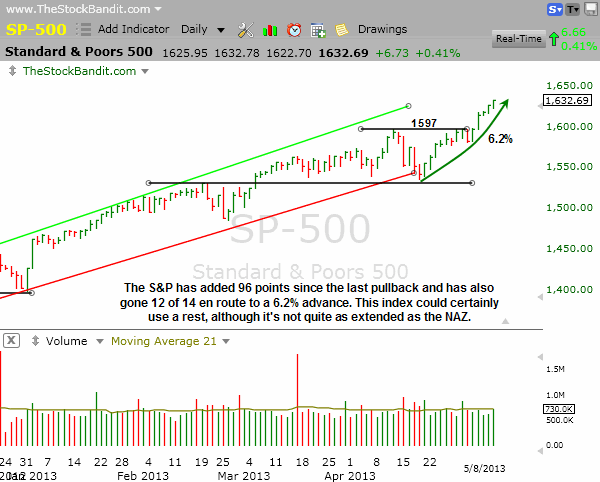
RUT – The RUT has gained 8% and is up 5% in just 5 sessions. That’s not a sustainable pace and I’d expect to see this index pause for a breather any day now. 954 was resistance so we’ll see if it can serve as support if tested on a pullback.
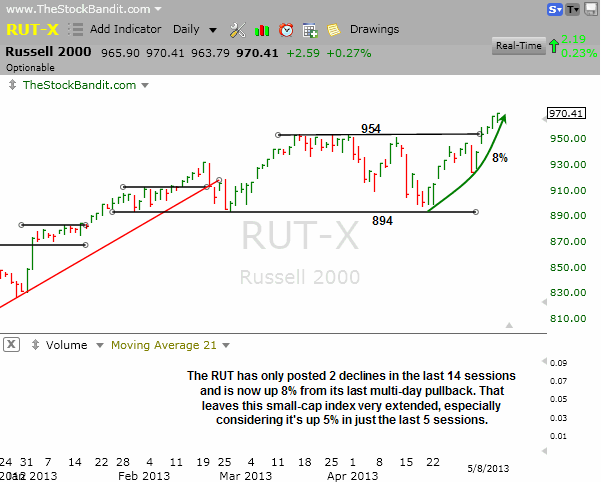
DJIA – The DJIA is grinding higher here since breaking out last week. It’s by no means extended, although it’ll likely take its cues from the other indexes and therefore could give back a little ground if market participants move to lock in some gains.
Notable Names:
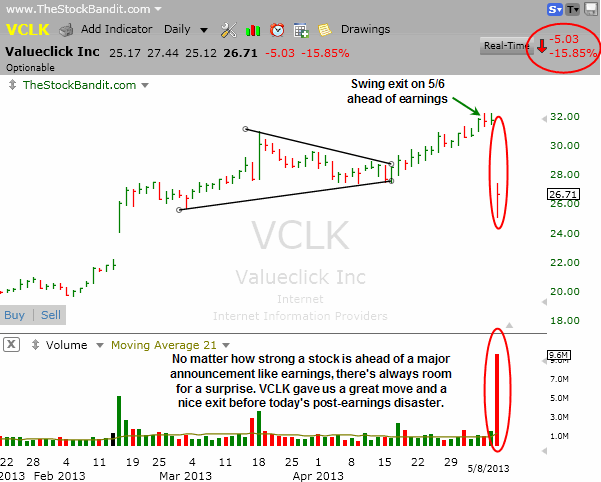
VCLK gave us a nice ride for a swing until hitting my aggressively-tightened stop ahead of earnings. Today’s move just goes to show that the chart goes out the window when fundamental news is announced, which is why I avoid holding trades into earnings. The biggest factor is the inability to manage risk, as seen by the size of the overnight gap.
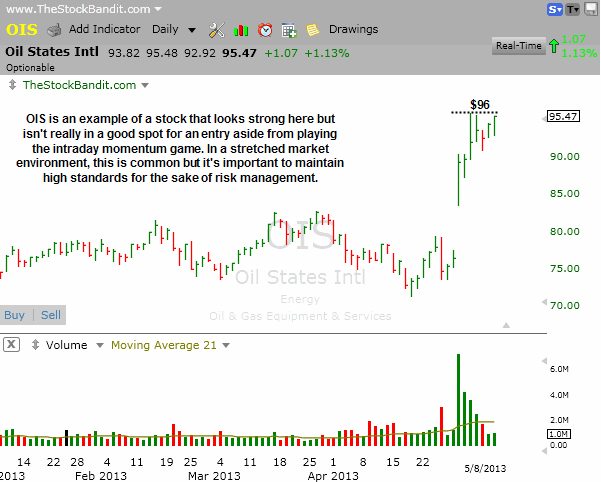
OIS is bullish here, without question, but has made such a big move that determining an appropriate stop is much more difficult than it would be had the stock been basing. A new high could be worth a momentum play, but volume isn’t suggesting this move has a lot left in it.
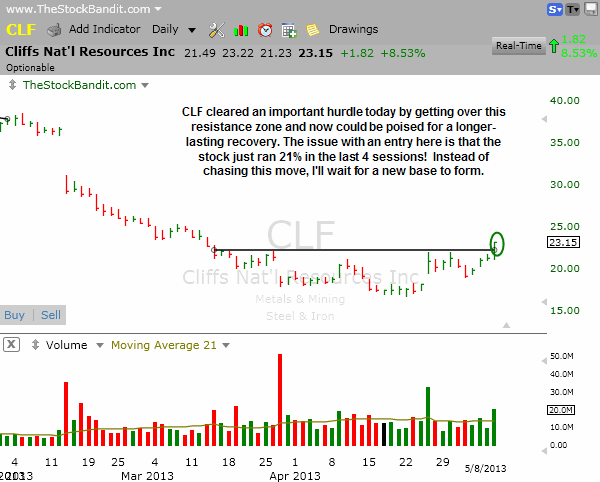
CLF cleared key resistance today after carving out a higher low on the daily chart last week. However, it’s up 21% in just 4 days, so it badly needs rest. I’d like to see a quiet pullback in the coming days and will therefore just keep it on the radar instead of buying after this move.
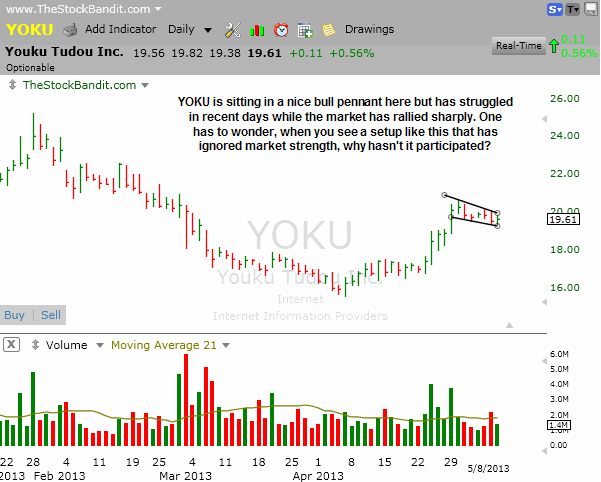
YOKU is basing here but after recent strength it’s suddenly very quiet and not participating in a rising market.
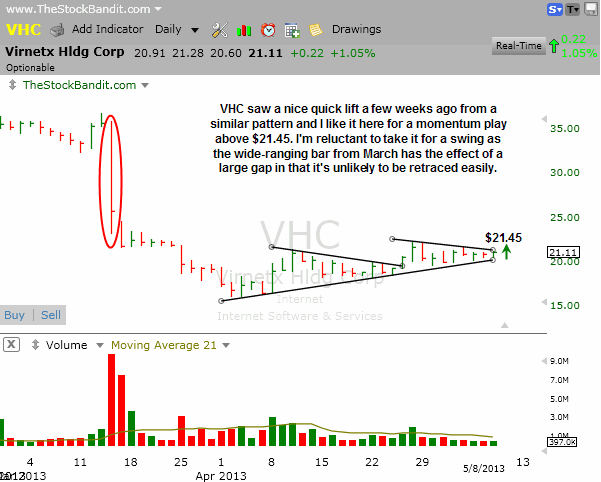
VHC has been steadily rising in recent weeks after a big correction and now faces a resolution to this wedge. A similar setup provided a quick pop a couple of weeks ago, so I like this one for a momentum play. This is not a swing candidate for me as it’s just rare to see a stock make rapid headway retracing a catastrophic move like we saw back in March.
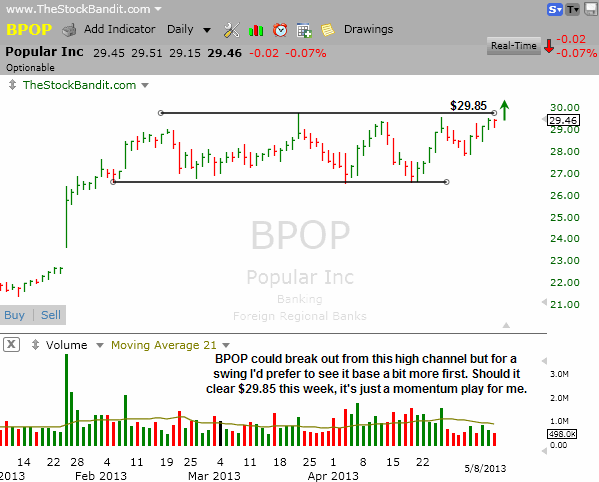
BPOP is facing a potential breakout here and I like it for a momentum play above $29.85. I’d much prefer to be setting up primarily swing trades right now instead of these momentum plays, but with the market so stretched it’s just next to impossible in many cases to determine an adequate stop. This is yet another example of that, as resistance is well-defined but a valid stop is not.
AGN is starting to roll over again here and could be worth a momentum short sale if it breaks $102.90 as this bounce begins to fail. I’m averse to swing trading these drug stocks given the frequency of huge moves and gaps.

New Swing Trade Candidates:
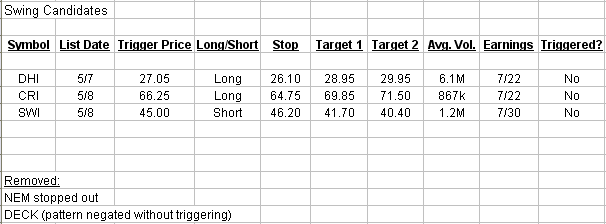
These stocks look ready for imminent multi-day moves. Pattern confirmation occurs with a move through the entry level. Initial stop and target levels are also provided.
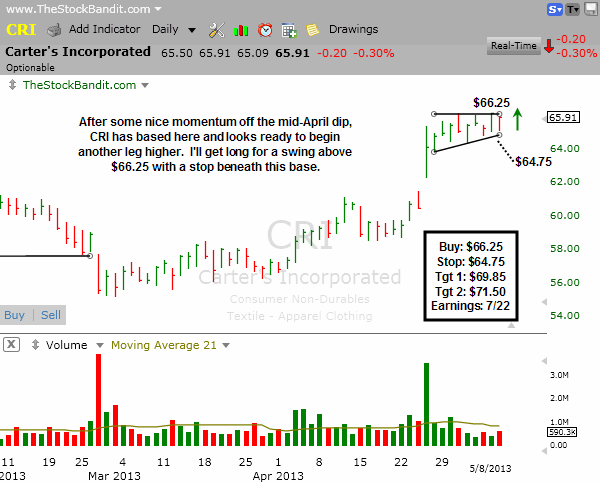
CRI is facing a breakout here from this base and rising support is more clear tonight. Last night I had listed this one as a momentum play but it did not trigger. A push through to a new high will trigger a buy for me as a swing trade, and I’ll have a stop set beneath rising short-term support.
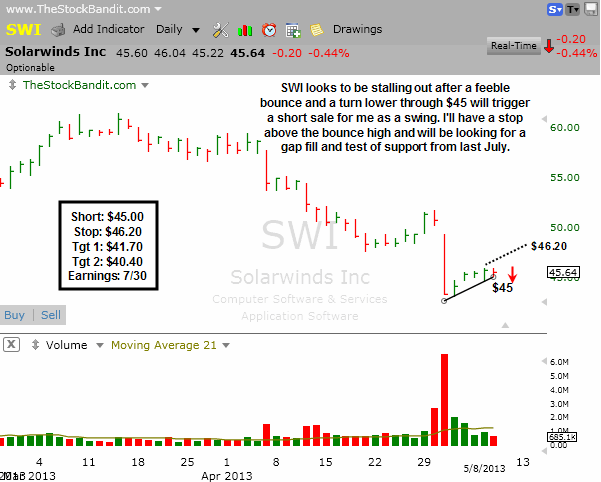
SWI has been trending lower and this little multi-day bounce may be starting to fail. I’ll get short for a swing trade below $45 with a stop above the bounce high in case of an upside reversal. There’s an unfilled gap and some support from last July which I’ll be looking for this stock to test once it gets going again to resume the downtrend.
Bullish Watch (click for charts)
Bearish Watch (click for charts)
Trade Like A Bandit!
Jeff


