


Good evening StockBandits!
A bounce attempt Friday failed to impress, and as the weekend concluded, overseas markets slipped further. China saw a 5.3% decline Monday on credit concerns, eroding confidence further. The worry produced a downside gap to kick off our week. After a hard pullback, a downside gap is sometimes utilized for upside reversals, but not today.
Instead, no gap fill attempt was made and the selling actually intensified for the opening 40 minutes or so. From there, some intraday support was found for a couple of hours before the market caught a bid. The bounce lasted until the final hour of the day, when selling kicked in once again. Ultimately, we finished well off the session lows, but also well off the highs, closing well in the red after another tentative attempt to bounce.
So where does this leave the market? Well, as feeble as it was, we did see a bounce attempt today. That’s the second straight session we’ve attempted to rally from lows, and one of these days there will be a longer lasting lift. For now, the bulls have seen their boldness erode and now market participants are being hit with not only negative headlines and increased worry but also lower prices. That’s serving as a reminder to raise cash at higher prices if given the chance, and I believe that mentality has prevented these bounce attempts from gaining any traction.
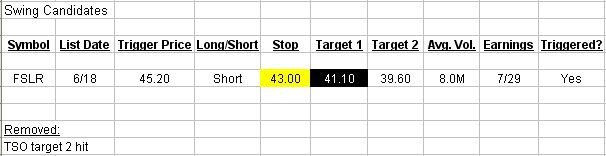
The indexes are technically broken, so even a multi-day bounce would do little to repair the damage done by lower highs and lower lows. At the moment, it’s too late into the decline to be shorting, but the long side isn’t paying off yet either. I was able to book more profits today on the TSO swing, leaving me with just a single position (and a half position at that after FSLR hit target 1 last week) on the short side. I’m willing to trade the long side here, but only for quick flips so that will be my focus for tomorrow.
In terms of adding new swings, I’m going to need to see some failed bounces to create some new shorting opportunities, or some cleaner falling wedge type patterns to set up some longs. I have no interest in trying to pick a low and getting long arbitrarily in hopes of nailing a turn, so I’m going to be patient in establishing new positions.
Let’s get to the charts.
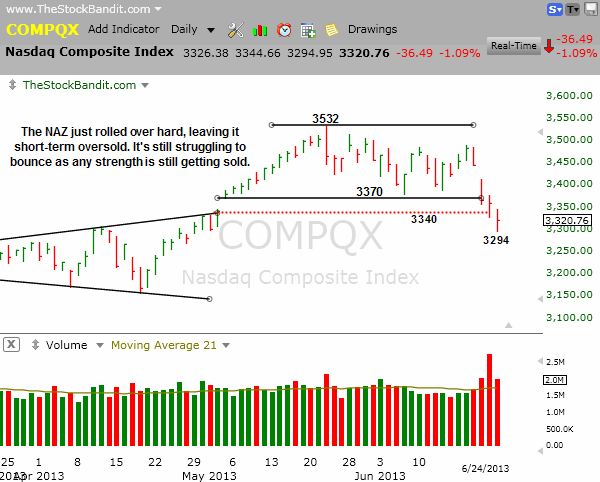
NAZ – The NAZ had shed 194 points off its session high from last Tuesday into today’s low, representing a 5.5% decline in just 4 sessions. That’s not a sustainable pace, and the subsequent bounce we saw this afternoon surprised few experienced traders. It wasn’t a matter of if we would bounce, but when. Now the big tell will be just how far the rebound carries, and if it results in yet another lower high. The weak finish today reminds us that confidence has been disturbed in recent days and that’s not going to be quickly forgotten by those who missed their exits on the way down. 3370 is a logical spot for this bounce to gravitate toward, although I’m not married to that number now that we’ve filled the May gap.
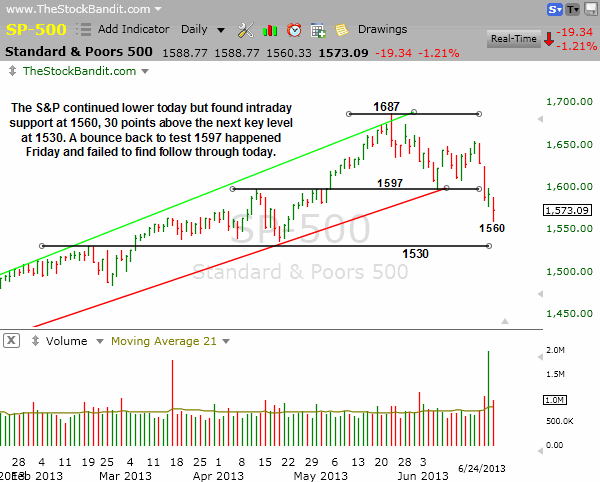
SP500 – The S&P gave up 5.6% off its high of last Tuesday into today’s low, leaving the proverbial rubber band quite stretched. For a 4-day decline, this index covered some ground quickly. Today’s snapback rally gave a decent starter lift off the low, although much remains to be seen for this index. The fact is that the bounce will need to play out further before we can truly gauge anything from it. With the last bounce high at 1654, we could see a nice bounce which still results in yet another lower high, so that’s something to consider. 1560 was the low today, but 1530 is the key support level which could still get tested.
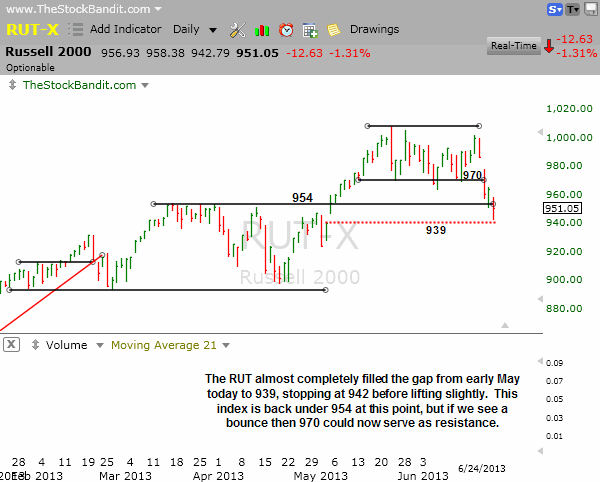
RUT – The RUT had gotten down some 5.8% from its intraday high of just last Tuesday to today’s low, leaving it extremely stretched on the downside and ripe for a rebound. This afternoon, we saw exactly that as an incremental lower low just after noon ET was chased by enough buying to make a higher high and then find follow through, at least until the final hour when it sagged again. It still ended almost 1% off the low, so we’ll see if the selling abates to allow a larger bounce to potentially carve out another lower high in the days ahead.
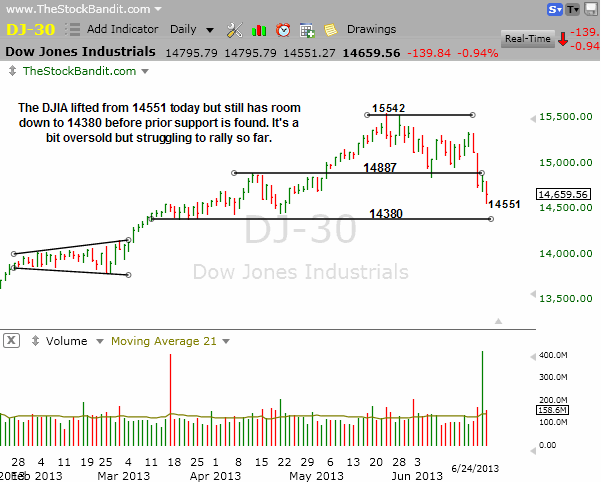
DJIA – The DJIA had given up almost 800 points since last Tuesday’s high into the low this morning. For the session, it was down more than 250 before bouncing back sharply as shorts rushed to cover and bulls put cash to work to play the snapback. The early losses were largely erased until another final hour dip. Nonetheless, we now have a downside level to trade against in the short term at 14551. Below that is 14380, which I’ve noted here many times since March.
VIX – The VIX is considered the fear index, and historically high levels are well beyond 40. Tonight it closed above 20, which isn’t high other than by comparison to the 11 it saw back in March. This points to concerns rising along with the market downside, so this inverse relationship is one to keep an eye on as the higher it goes, the wider-range bars we tend to see in the averages (along with lower prices of course).

Notable Names:
AAPL broke the $419 level last week and continued further down today. It seems bent on tagging (or breaking) the $385 level, so there still is zero compelling reason to consider the long side in this stock. From $700, $500 looked “cheap.” $400 might be a steal, time will tell, but for now it’s still moving lower and that should be respected until there’s a technically bullish reason to buy.

TLT painted a bullish engulfing bar two weeks ago which failed to find any lasting follow through, and today we saw this ETF paint a new low and then reverse to finish positive. It’s certainly oversold and the very heavy volume could be indicating it’s a bit sold-out for now, so this is just an indicator to keep on the radar as we await signs of stability.

YHOO accelerated today on the downside and this stock has undergone a serious change of character in the last week. The steady uptrend is gone, and now rallies will likely be sold. This is what the early stage of a trend change looks like.

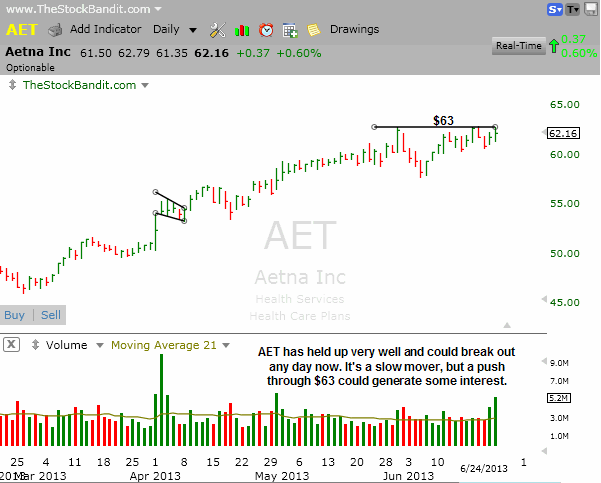
AET is coiling just beneath resistance and may break out soon. Given the slow pace this stock tends to move at, I’m not looking to trade it Tuesday, but it has held up quite well so I wanted to point it out due to its relative strength.
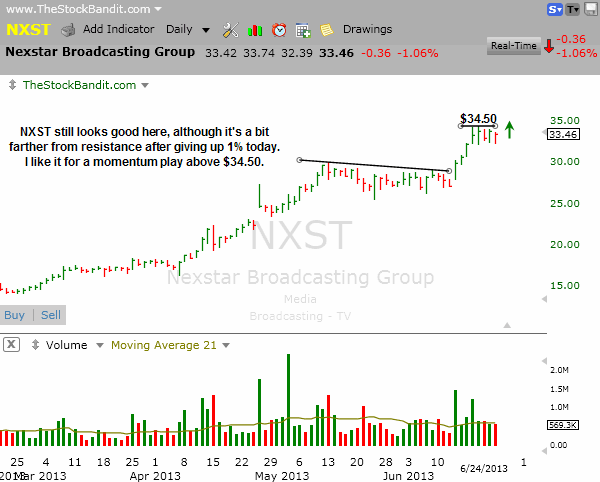
NXST is still working on a bull flag like pattern here, although it gave up a little ground today. I like it for a momentum play Tuesday through $34.50. It’s a good enough base here for a swing on the long side, I just would prefer to see the broad market stabilize a bit more first.
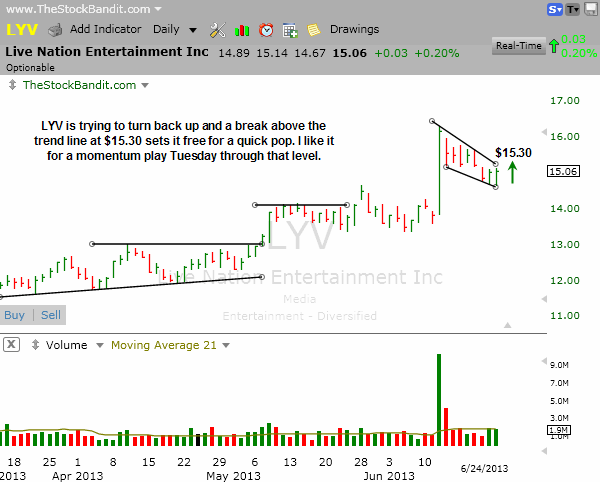
LYV saw a big spike higher a couple of weeks ago and has quietly pulled back since. It’s now in a falling channel here and an upside resolution at $15.30 could generate some interest. I like it for a momentum play through that level, although not for a swing given that the last leg up was only a single-day move.
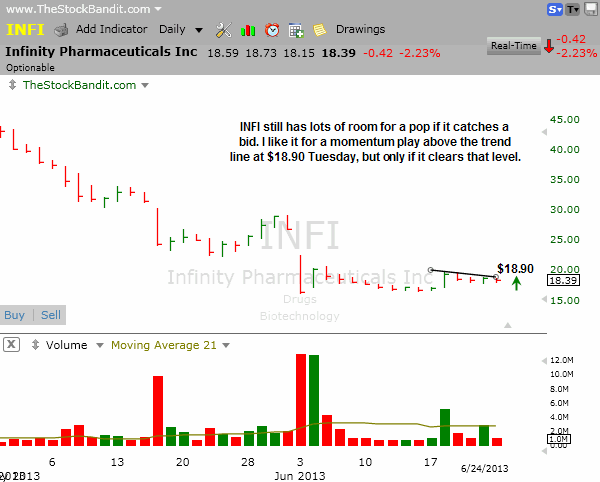
INFI is still on my radar with the potential to carve out a higher low after a major correction. A turn up through the trend line at $18.90 looks good for a momentum play, although this one is just too volatile for my taste as a swing.
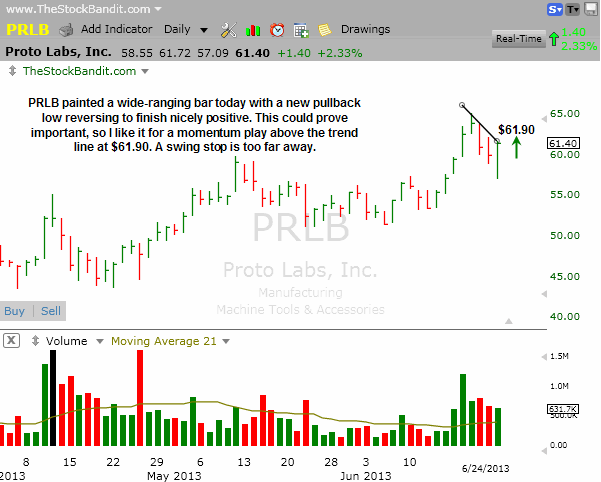
PRLB saw a new multi-day pullback low today and then reversed sharply higher. I like it for a momentum play above the trend line at $61.90 on Tuesday, but this base would need more work before I’d consider it for a swing.
New Swing Trade Candidates:
No new swing candidates tonight, waiting for better risk/reward opportunities after some nice trades.
Bullish Watch (click for charts)
Bearish Watch (click for charts)
Trade Like A Bandit!
Jeff


