


Good evening StockBandits!
It was another narrow-range session today with the NAZ being the only among the major averages to see any increased volatility. The DJIA, S&P 500 and RUT each made incremental new highs but failed to exhibit any real momentum. By the closing bell, the net changes were again extremely minor as traders awaited the arrival of another market-moving catalyst. You can almost hear traders repeating the phrase “waaaait for it…” but growing tired of doing so. AAPL earnings came out this evening and it was giving the futures a small lift, but doesn’t appear to be anything of great significance.
We’re smack dab in the dog days of summer right now. It’s historically a time when many are on vacation, volumes tend to be down, and activity is greatly reduced. Toss into the equation the fact that the indexes remain very extended at the moment, and there’s just a very limited sense of urgency when it comes to making big bets at this stage in the rally.
Both bulls and bears alike are rooting for a dip to either put cash to work or exit painful short positions, but the market just isn’t yet accommodating anyone. Instead, we’re putting in what equates to a very narrow base, albeit not of the standard type. It’s much more typical to see some back and forth during basing phases, yet it’s almost all been ‘forth’ of late with the rest days still being painted green – they’re just much smaller advances.
I’ll continue to keep a close eye on the earnings calendars (I use EarningsWhispers and Yahoo! Finance primarily), while looking for high-quality setups with risk/reward parameters that look favorable and in stocks which appear to have some time to move before the next scheduled news. Without lowering my standards for new plays or making a big anticipatory bet (not my style), that’s all I can do.
Let’s get to the charts.
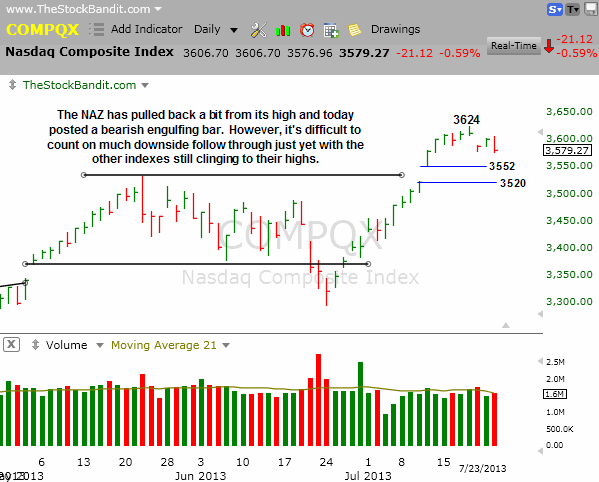
NAZ – The NAZ was the weakest today with a 21-point slide after its third attempt to fill the gap lower from last Thursday’s closing level. Tonight the futures are higher after a positive response to AAPL, which could give this index a positive start tomorrow. The upside level to watch is the high at 3624, whereas any further retreat could bring a gap fill to 3520 from two weeks ago.
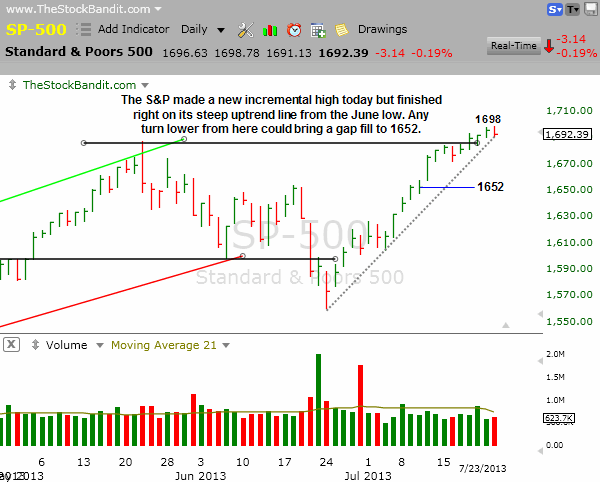
SP500 – The S&P remains above 1687 but still just by a few points. Tonight it closed right on its uptrend line from the June low. Should we see a break of rising support and a move back beneath 1687, then 1652 could come into play in the near term for a gap fill. For now, no real selling has begun.
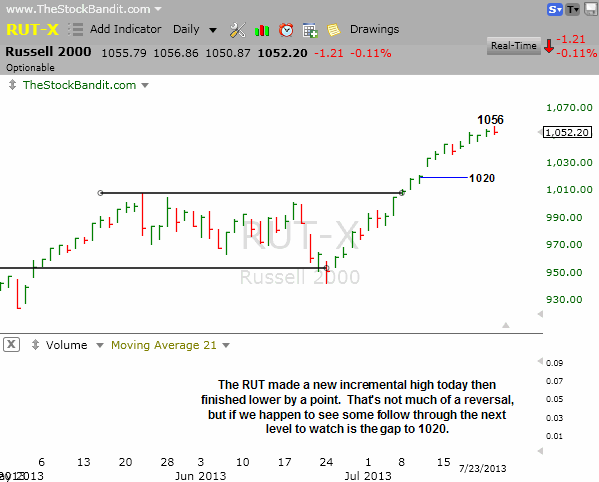
RUT – The RUT continues to make incremental new highs but is maintaining the look of fatigue up here as the pace has slowed to the upside and intraday ranges have become extremely narrow. Any turn lower could bring a move down to 1020, but the past 5 sessions have each failed to undercut the prior day’s low and that means still no real selling yet.
Notable Names:
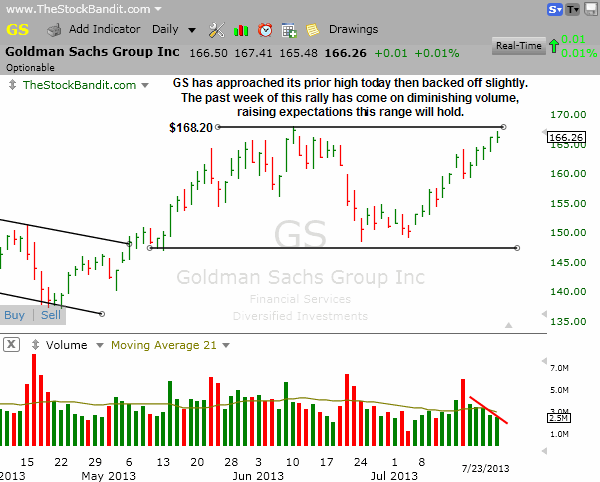
GS is at the upper end of its range after a lot of green lately. However, a breakout here would be rather suspect given the diminishing volume that has accompanied the most recent portion of this advance.
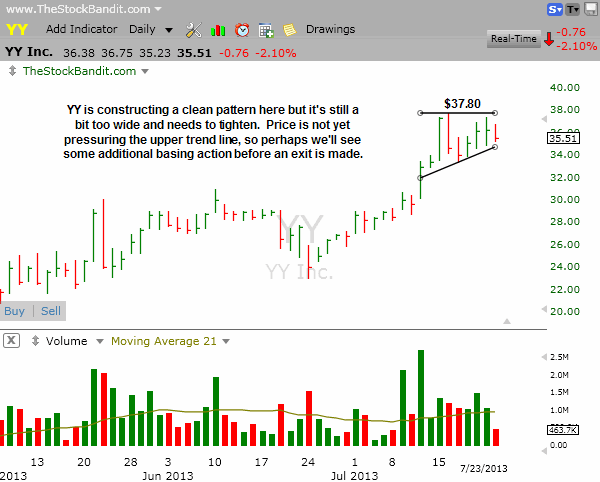
YY is basing here but this ascending triangle needs to mature further to obtain a tighter appearance. Price isn’t challenging the upper resistance yet, which may allow this setup to develop a bit more before a breakout attempt is made.
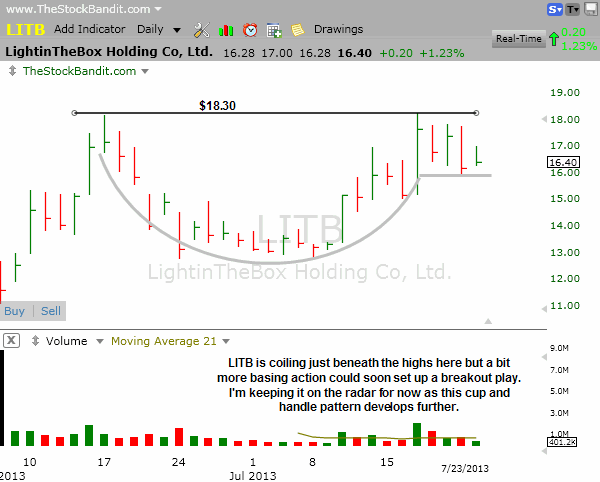
LITB is a new issue but it’s constructing a large cup and handle pattern here. The handle portion of the pattern needs more basing action, but I’m keeping this one on the radar while waiting for price to begin challenging upper resistance.
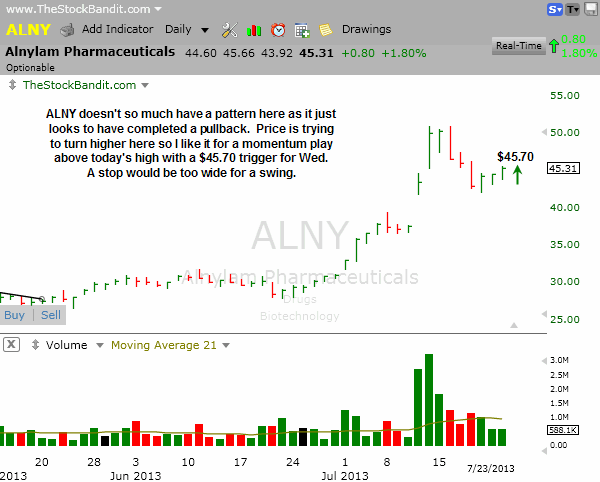
ALNY is turning back up here after a recent pullback and could catch a bid Wednesday for a momentum play if it’s able to clear $45.70 to make a multi-day high. This is not a swing candidate for me though due to the distance a stop would be placed from entry.
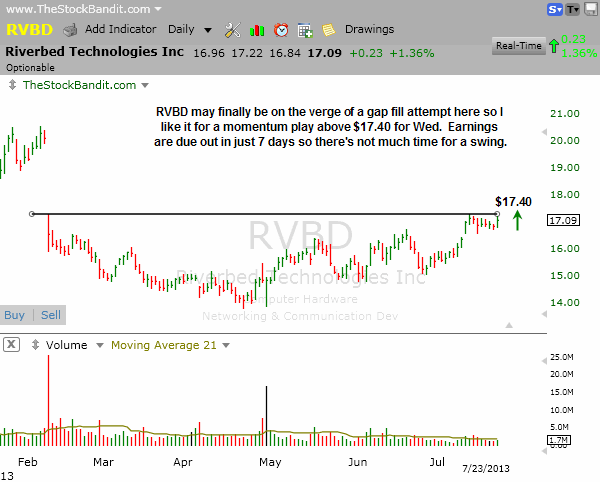
RVBD is perhaps ready to attempt a gap fill, but earnings are due out in a week. That’s not much time for a swing, so it looks good for a momentum play here to capture the initial breakout attempt if it’s able to clear $17.40.
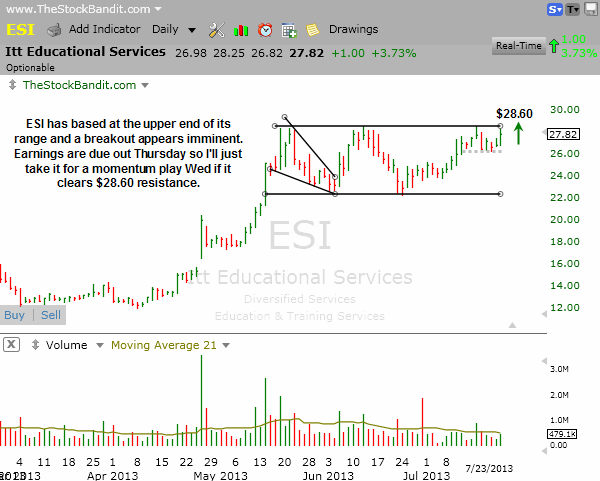
ESI is at the upper end of its range here and a breakout could come any day now. Earnings are due out Thursday, so rather than take it for a swing I’ll just look to capture the initial breakout for a momentum play through $28.60 if it happens on Wednesday.
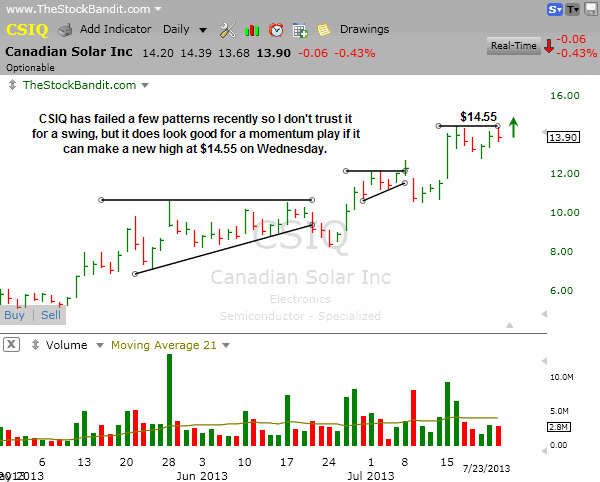
CSIQ is churning here but a new high at $14.55 sets up a momentum play for Wednesday on the long side. A swing stop is not readily apparent until some tightening occurs on this daily chart.
New Swing Trade Candidates:
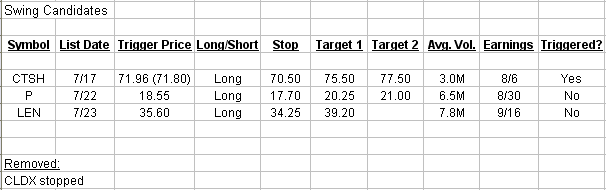
These stocks look ready for imminent multi-day moves. Pattern confirmation occurs with a move through the entry level. Initial stop and target levels are also provided.
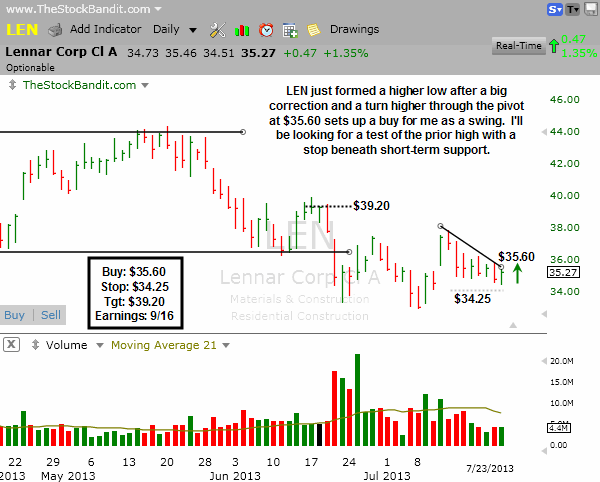
LEN has a chance to confirm a higher low here following its recent 30% correction off the May high. A turn up through the trend line at $35.60 and I’ll take it for a swing with a stop beneath this support zone and a target near the prior high. Earnings are almost 2 months out, so there’s plenty of time for this one to work.
Bullish Watch (click for charts)
Bearish Watch (click for charts)
Trade Like A Bandit!
Jeff


