


Good evening StockBandits!
The major averages made no progress last week, and instead simply churned near their recent highs. That translated into no satisfaction for bulls who are itching for a pullback to deploy more capital, but also no satisfaction for bears who can’t get a down move to save their life. So, we saw 3 of the 4 key averages mark time while the NAZ edged higher thanks largely to some very positive responses to key earnings reports.
It was by all measures a standoff, which is the next-best thing in extended market conditions. The result of the lateral price action following a nonstop advance is the look of bull flags which could now spark another big lift if resolved higher, despite the need for more rest. The market accommodates very few, so with both camps still rooting for a dip, there’s certainly a chance we don’t get one yet.
Aside from the distance which price has carried without a realistic pullback since the June low, we also have very lackluster volume accompanying the rally. Only a small handful of sessions have seen above-average volume alongside the advance, leaving many doubters in the wake of this lift. Nonetheless, the market has pressed higher, rewarding those who ignore risk the most.
I’ve been expecting and hoping for a decent dip for a few weeks now, and I’m not the only trader frustrated by the lack of one. It isn’t that we need a spooky selloff at this stage, but rather just some normal profit-taking. The nature of this move has been relentless, and it’s difficult to embrace a wildly bullish stance here without a pullback. But should the indexes break higher, that’s our technical cue that the northbound train is again on the move and that the bull flags are being confirmed. It’s imperative to keep an open mind here and shelve any directional bias, because with this high, tight consolidation, it could set off a very decisive move in either direction.
Let’s get to the charts.
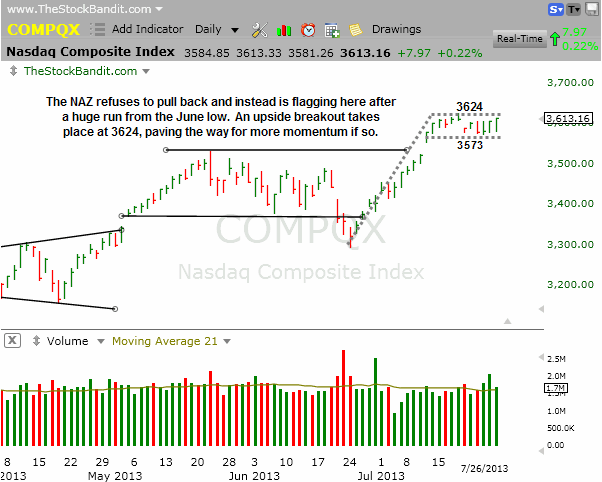
NAZ – The NAZ led the way last week, thanks in part to positive earnings reactions to AAPL, FB, AMZN, SBUX and others. This index was the only one with a meaningful gain, although it held inside its recent high-level base. A breakout to a new high could see this index stretch its legs further, which would happen beyond 3624. A pullback would be ideal, but it just can’t seem to pull it off. I’ve been looking for a pullback so much lately that I mistakenly overlooked this bull flag until the last couple of days. A turn higher from here, despite the fact we’ve come a long way since late June, could bring momentum right back into the picture for this index.
SP500 – The S&P continues to churn just beneath 1700, and this index also has not been able to put together even a modest pullback. Even quiet declines on Thursday and Friday were each met with afternoon strength, erasing the deficits for each session and leaving this index at its highs by the closing bell. That’s certainly bullish, so it would be biased to ignore that kind of price action within a high-level base like this. We’ve seen a little bit of rest, but still no pullback. Any breakout through 1700 will need to stick, as a breakout followed by a reversal would be viewed by many as a short-term last gasp for this big lift off the June lows. Otherwise, a breakout paves the way for another bull run.

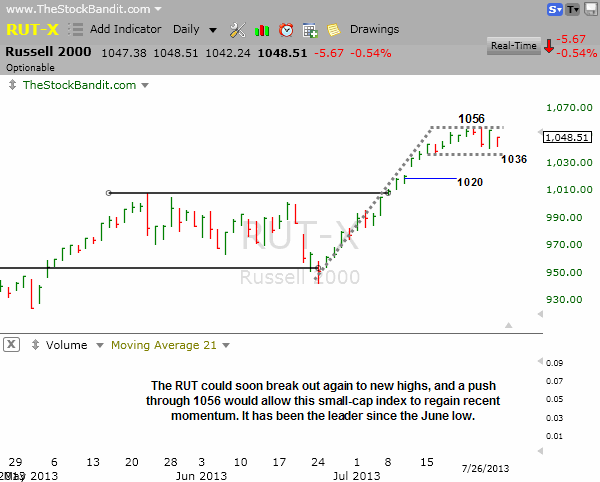
RUT – The RUT remains just a few points shy of its highs as well, but has attempted to pull back a bit in the past few sessions. This daily chart has a bit more of a rounded look to it than the other flags we’re seeing. Nonetheless, it too is proving to be very resilient despite having become extremely overbought just a few short days ago. Keep a close eye on the high at 1056 for a breakout and the return of momentum, and on the downside watch the unfilled gap to 1020 just in case it rolls over.
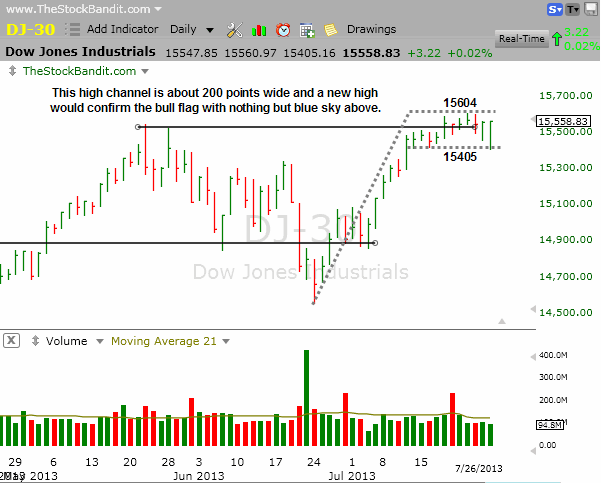
DJIA – The DJIA is the least extended of the bunch, yet it isn’t likely to take off without the others. For now, it’s in rest mode and that’s certainly a positive way to digest the recent run off the June low. The high is at 15604 and a solid push through there would confirm this bull flag-like pattern, paving the way for much higher prices.
Notable Names:
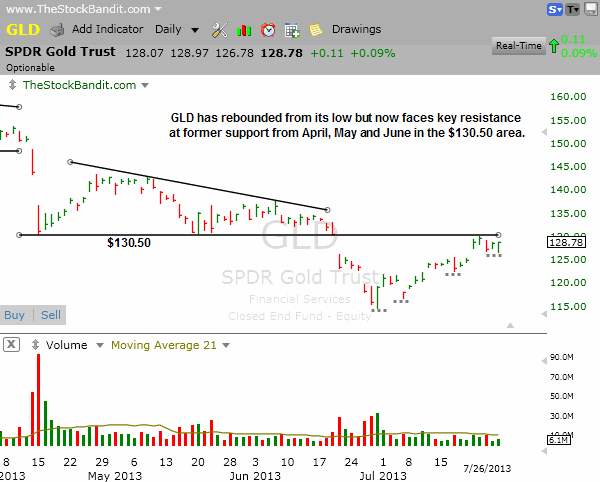
GLD has bounced from the low of a few weeks ago and has created a few short-term higher lows, but is currently sitting beneath a major level of prior support (now resistance) at $130.50. This is a logical area for the recovery to stall out, and if so, gold bulls will need to watch for a higher intermediate-term low on the next pullback.
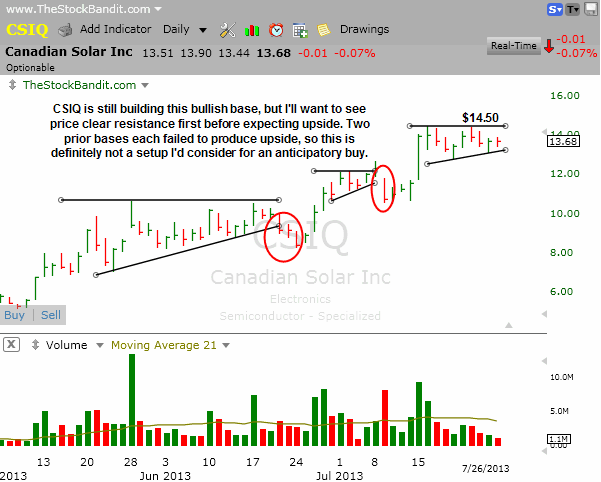
CSIQ is a solar stock currently sitting in a bullish pattern. Price isn’t yet challenging the breakout zone near $14.50, but perhaps more important is the recent history of this identical pattern having been resolved lower twice in just the last two months.
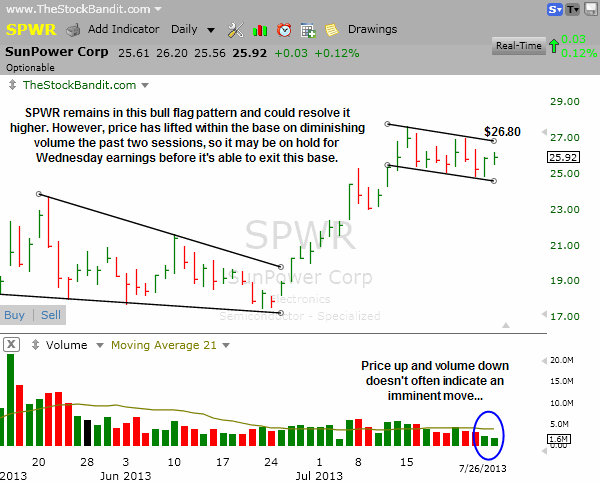
SPWR is another solar stock sitting in a nice descending channel here or bull flag if viewed from the late June low. Breakout would be at the $26.80 level as the upper trend line is crossed, although volume isn’t yet indicating an imminent move and earnings are just a few days away so it may simply be on hold until then. It is one to have on the radar for now.
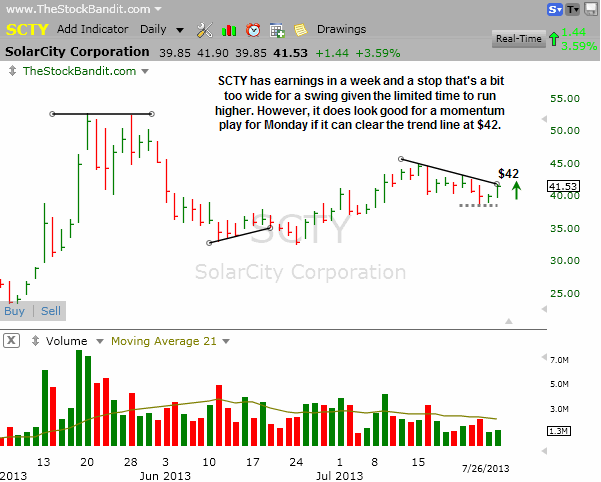
SCTY is attempting to turn back up here after possibly finding a pullback low last week. A turn up through $42 sets it in motion for an advance here, and I like it for a momentum play above that trend line for Monday. Earnings are due out next week, so there isn’t much time for a swing given the wide stop that would be necessary for a multi-day timeframe.
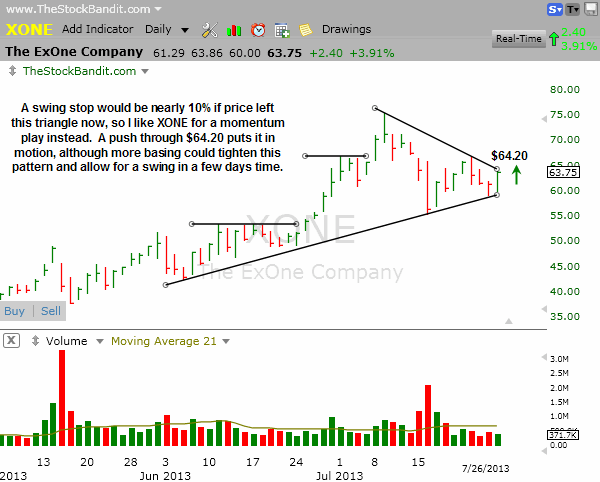
XONE is at the upper trend line of this wedge and a break above $64.20 could generate some short-term buy interest as this pattern gets resolved. Here again, a swing stop would belong beneath the pattern and that’s just too far away.
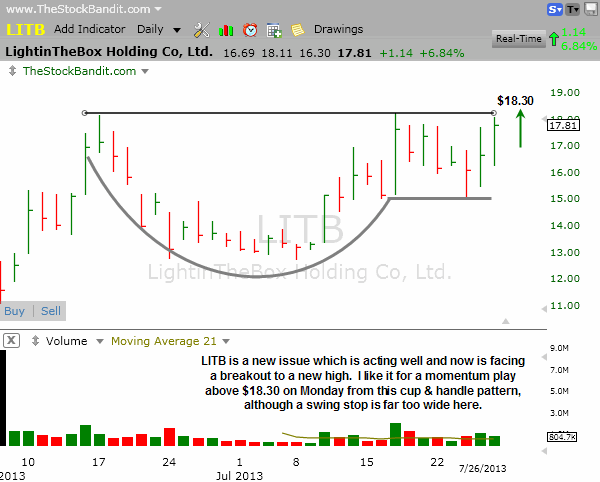
LITB is working on a cup and handle pattern here with a pretty wide handle from near $15 up past $18. I like this play for a momentum play for Monday if a breakout occurs through $18.30, but the handle would need to tighten first to warrant a swing.
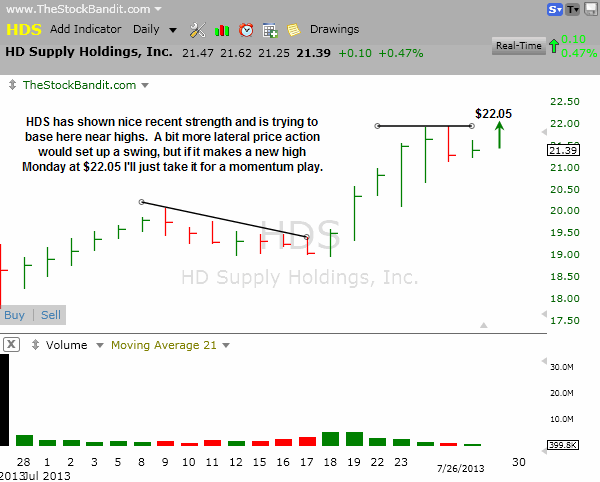
HDS is at short-term resistance after a couple of days of rest since its recent rally. This is a new issue and needs to base a bit more before I’d consider a swing, but if it clears $22.05 on Monday it looks great for a momentum play on the long side as strength returns and new highs are made.
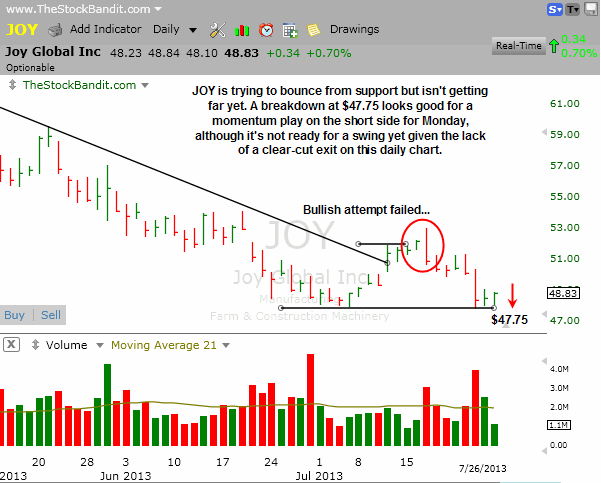
JOY is near key support here and a breakdown through $47.75 would likely trigger more stops and generate some short-term selling. I like it for a momentum short beneath that level if broken on Monday. Otherwise, I’ll wait for a possible swing opportunity if a well-defined low-level base is formed.
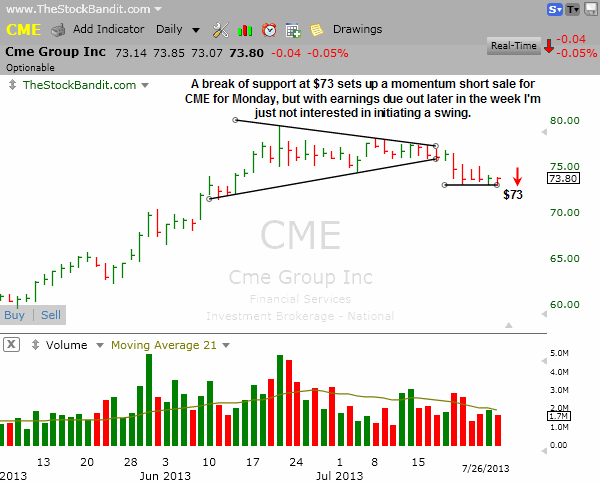
CME is still sitting just above multi-day support and actually might stay there since earnings are due out on Thursday this week. However, if $73 gets broken on Monday, it still looks good for a momentum play on the short side to participate in the initial break of this level.
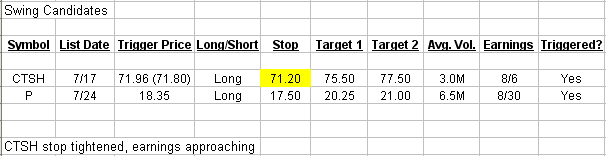
New Swing Trade Candidates:
No new swing candidates tonight.
Bullish Watch (click for charts)
Bearish Watch (click for charts)
Trade Like A Bandit!
Jeff


