


Good evening StockBandits!
The day began with some strength ahead of the Fed and a minor gap higher, but that faded and as the big event drew closer the NAZ was actually attempting to get into that gap. After the announcement, we saw the usual back and forth for a few minutes before a rally to new highs for the session by 3pm ET. However, the final hour was comprised of only selling as the market drifted right back down to (or through in the cases of the S&P and DJIA) the pre-FOMC levels. The lack of momentum right now is making traders take a collective “whatever” attitude, blowing off the notion that moves will last, which in turn may be perpetuating it as weakness gets bought and strength gets sold. We could see a change to that at any time now, but it’s the current description of this tape.
The weak finish doesn’t exactly look bullish on the surface, but we do sometimes see it take an extra day or so before the market makes up its mind after a Fed meeting. So, we’re still caught in short-term trading ranges not far from the highs waiting for something to trigger another round of buying (a breakout) or some meaningful selling (a long-awaited pullback).
My watch lists (linked at the bottom of this report) remain lopsidedly bullish, and I don’t want to ignore that. Ultimately, it’s the market that will determine my directional bias, and that will hinge upon the break from this range once it occurs. A retreat in prices should offer some shorting opportunities, and a breakout after this 3-week basing phase would allow many stocks to regain strength after some healthy rest. The key for now is not pressing positions and allowing the churn to continue, because it might.
** Be sure to submit your stocks for this week’s Charts on Demand video. If there are a couple you’d like my technical opinion on, just fill out the short form or hit reply to this email with the tickers included.
Let’s get to the charts.
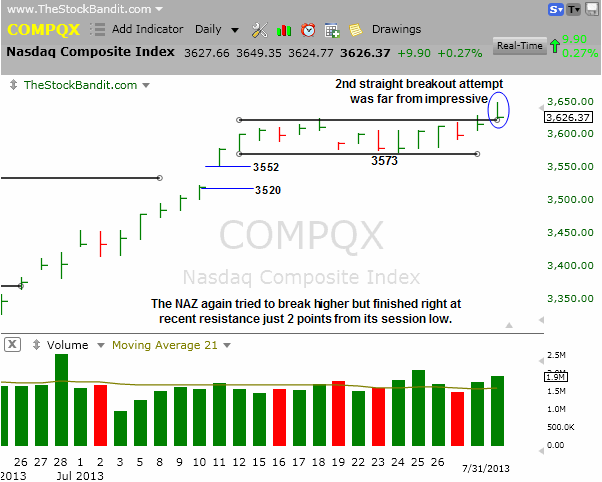
NAZ – The NAZ tried for the second straight day to make new highs, which it did, but once again it finished weak and was unable to maintain strength. Today it finished above the channel, yet near the session low. It now could easily fail this breakout and reenter the range.
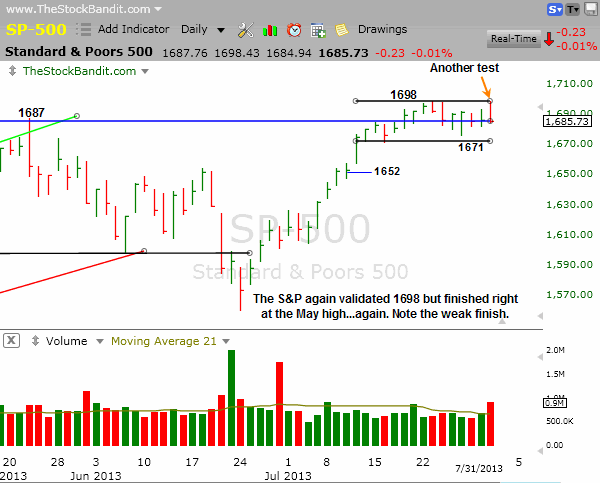
SP500 – The S&P is glued to the May high of late and tonight finished within 2 points of it, again nearly unchanged for the session. The channel it’s in is from 1671 up to 1698, the high which was tested again today before reversing lower to end fractionally red.
RUT – The RUT remains range-bound here between 1036 and 1056, ending just about in the center. Should this get resolved lower, I’d expect to see the gap to 1020 get filled rather quickly. On the top side, a breakout which sticks could produce more of the one-way price action we saw prior to this range.

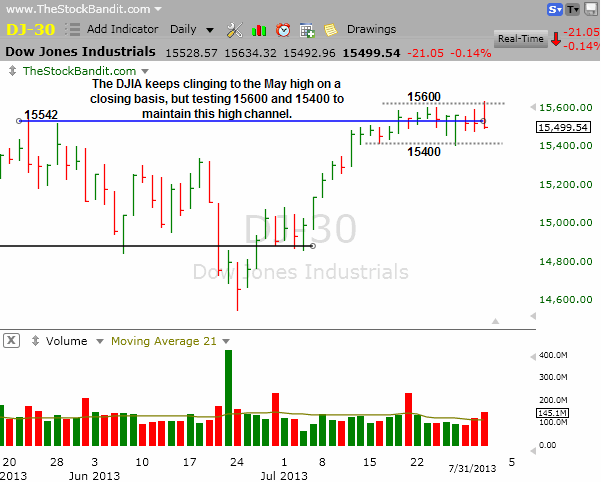
DJIA – The DJIA is also clinging to its May high, despite being in a 200-point channel of late. Today’s weak finish doesn’t yet threaten a downside resolution to this range, but it doesn’t look bullish with the increased volume we saw alongside it.
Notable Names:
VIPS is still working on this bull pennant but remains on watch for me while I wait to see price pressure the upper trend line. That could happen any day now, and when it does I’d expect a breakout attempt to quickly follow.

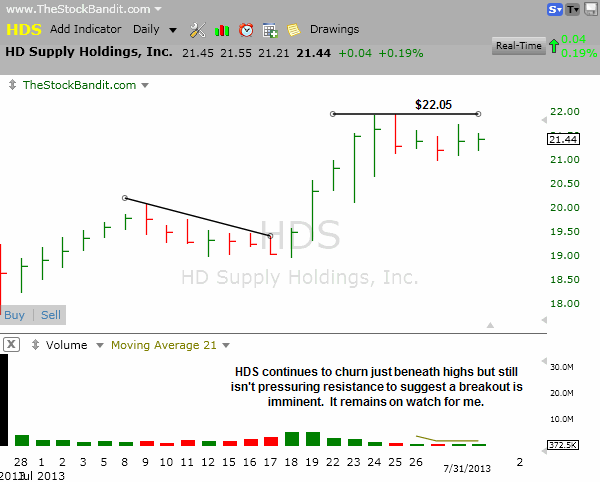
HDS is still basing beneath resistance here, so I’m keeping it on watch. It still has a little room to lift before it begins knocking on the door of a breakout, so if and when it does, I’ll consider it for a trade.
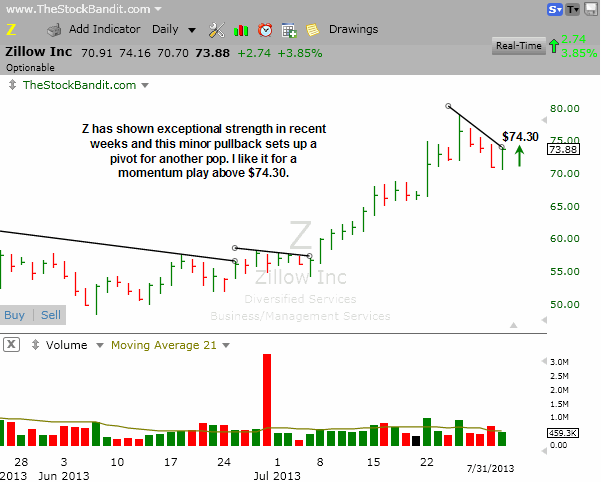
Z is trying to perk up here and a break above the small descending trend line at $74.30 could set up a quick pop in price. A swing stop is a bit farther away than I generally prefer, so I’ll instead take this as a momentum play to participate in the initial move higher if the trend line is crossed.
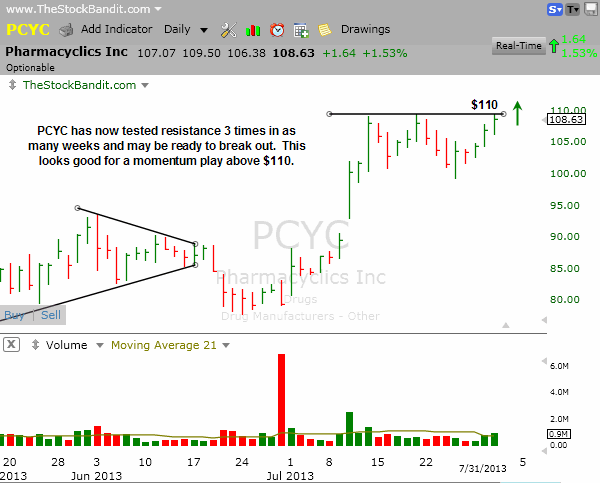
PCYC is at key resistance here and a new high could spark a quick rally. Here again, a swing stop is too far away to consider this one for a multi-day play, so I’ll instead take it as a momentum play if it’s able to clear $110.
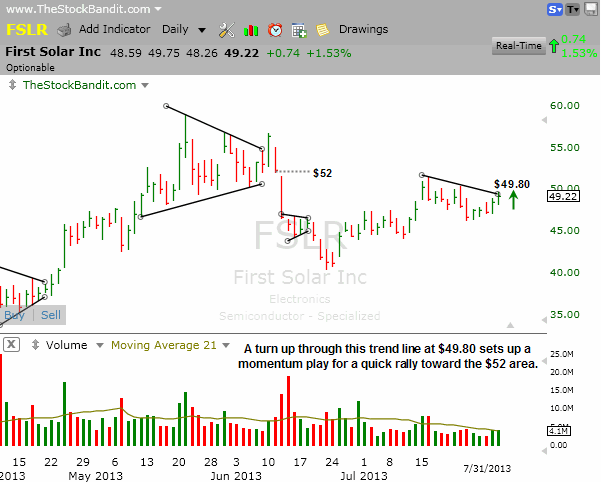
FSLR is sitting just beneath a descending trend line here, and has some overhead a few points higher so I’m not interested in a swing based purely on the risk/reward of this setup. However, it looks good for a momentum play if it can clear $49.80 with room to lift toward the $52 area.
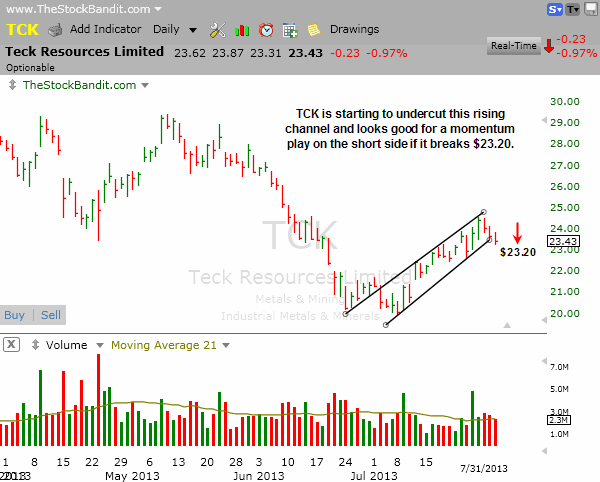
TCK is starting to undercut the lower trend line of this rising channel and could trigger some stops. I like it for a momentum play on the short side if it undercuts $23.20, but the risk/reward for a multi-day swing doesn’t appeal to me.
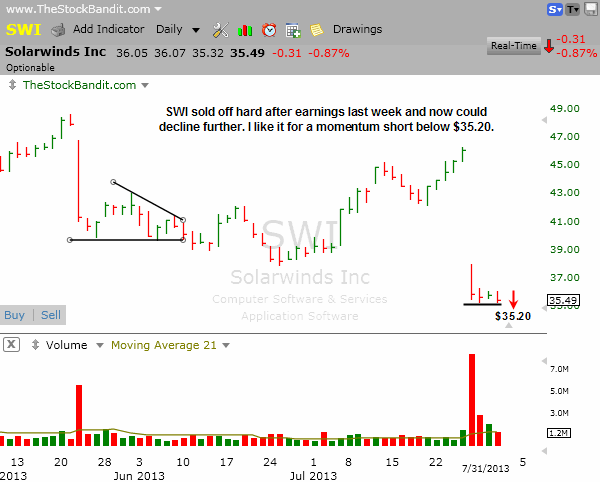
SWI is at multi-day support here following a massive breakdown after earnings last week. A new low could trigger more stops, so I like it for a momentum play on the short side if it breaks $35.20.
New Swing Trade Candidates:
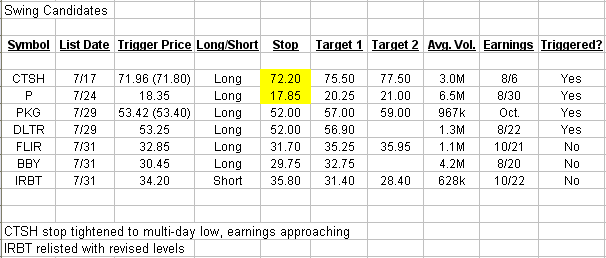
These stocks look ready for imminent multi-day moves. Pattern confirmation occurs with a move through the entry level. Initial stop and target levels are also provided.
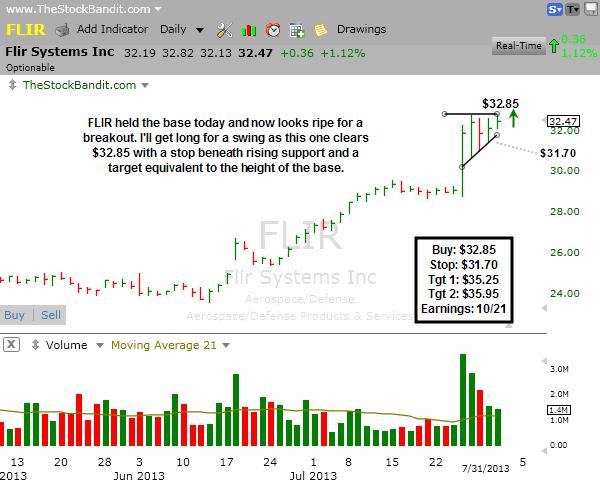
FLIR was highlighted here last night as setting up, and today did not trigger for a momentum play. The base is cleaner after today’s bar, so I’m now setting it up as a swing. I’ll get long if it clears $32.85 to make a new high.
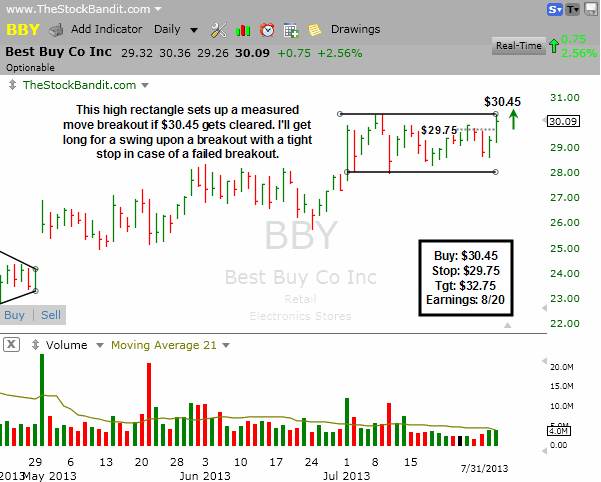
BBY has been basing for a few weeks in this high channel or rectangle pattern. This pattern has a measured move associated with it, which is the height of the base added to the breakout zone. I’ll get long for a swing if it clears $30.45 to confirm this pattern with a target at the measured move of $32.75. I’ll have a tight stop as I won’t want to see a breakout fail.
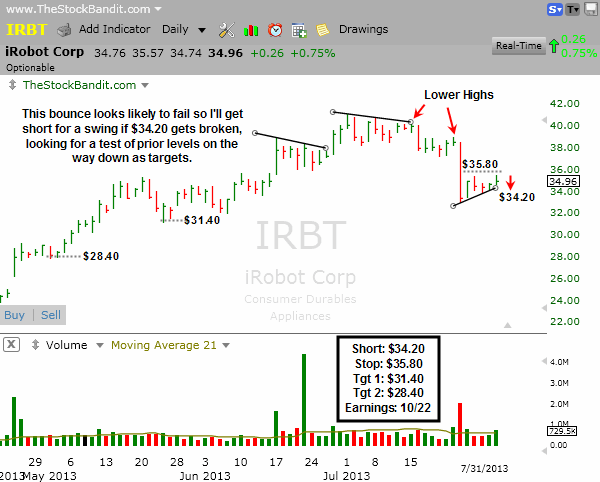
IRBT has been on the list for a couple of days but as the pattern has persisted, the levels have slightly changed. So tonight I’m simply relisting this play with some revised levels for entry and stop, although my targets remain the same. My swing short will now trigger if this one breaks $34.20.
Bullish Watch (click for charts)
Bearish Watch (click for charts)
Trade Like A Bandit!
Jeff


