


Good evening StockBandits!
The NAZ tested its range low yesterday and today the RUT made an incremental new low (fraction of a point), but both of them were able to finish green on the session to stop the bleeding – for now. Today we also saw the blue chips rebound, but across the board the character of the advance was still easily overshadowed by the nature of the selloff since Monday’s intraday peak. The bulls might be holding support in the more speculative indexes for now, but fresh on the minds of everyone is the relentless selloff we witnessed late Monday and all day Tuesday, as well as the subsequent support breaks in the S&P and DJIA.
Today’s action was really best defined as a relief rally. That’s a term heard often, but it was appropriate today as the selling abated and prices lifted, but not with great vigor and it certainly didn’t carry very far. Only a fraction of Tuesday’s losses were reclaimed with today’s bounce, sort of in a two steps forward, one step back fashion. That should keep the bulls on their heels and the bears aggressively selling into strength until something more meaningful happens to put an end to the correction.
Quite a few charts tonight have a messy appearance to them, meaning there aren’t many quality bases out there. The bounce last week, intraday reversal Monday, gap lower and continuation on Tuesday, and then today’s modest bounce has left many charts with short-term trading ranges which are rather wide. Those loose bases just tend to come with greater volatility as we’ve seen the past few days, but likewise they tend to best serve only the quick plays. Due to this, my focus again heading into Thursday’s session will be on the shorter timeframes as that’s where the opportunity (and the ability to better manage risk via tighter stops) currently lies.
Let’s get to the charts.
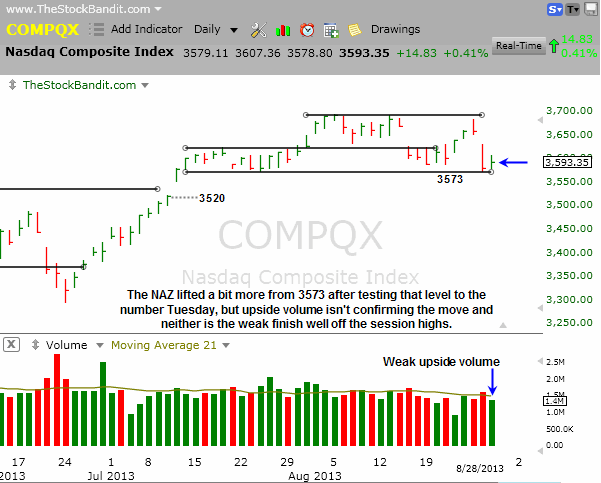
NAZ – The NAZ tagged 3573 yesterday and I mentioned that the bulls needed to get in gear right away to avoid a quick gap fill to 3520. Today they held their ground, but certainly not in an impressive manner. The weak volume and finish off the highs doesn’t give this bounce the look of longevity.
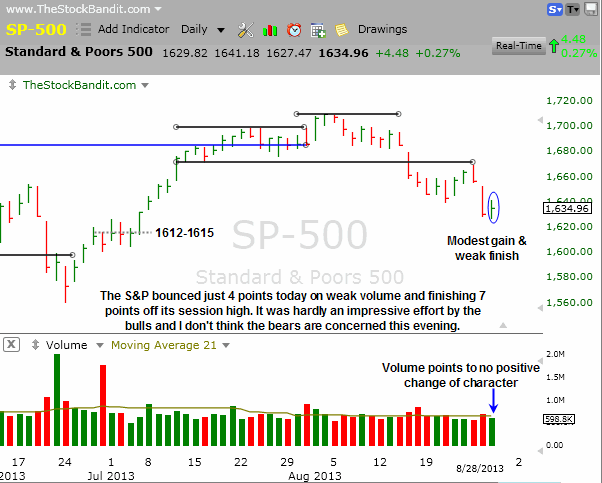
SP500 – The S&P saw a modest snapback attempt today but the feeble finish and poor progress on the way back up also gives this broken chart little chance of lasting follow through. I’m still looking at the 1612-1615 area as the next zone this index could test.
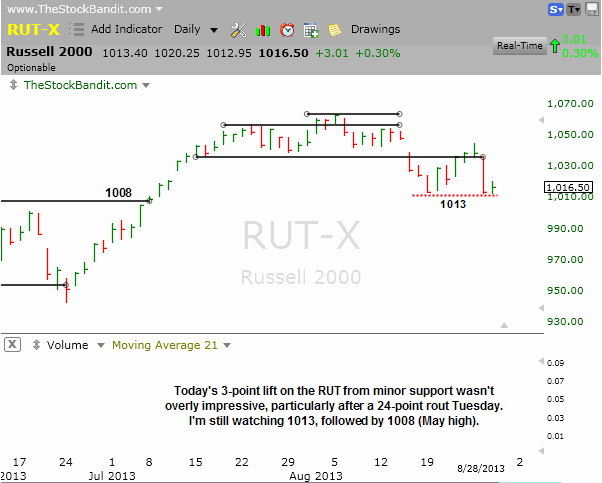
RUT – The RUT briefly broke 1013 but held, finishing just a few points above it. This index already confirmed a 2nd lower high since the August peak of 1063, and 1008 begs to get tested as the May high and July breakout zone.
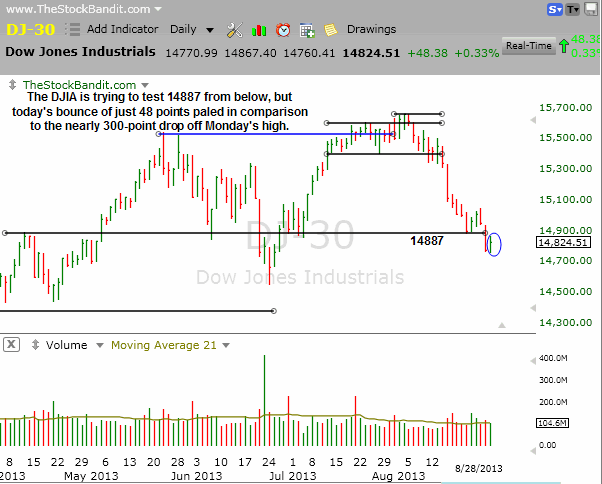
DJIA – The DJIA bounced back up toward 14887 today but couldn’t reclaim it, further validating Tuesday’s breakdown. This index has some room down to the June low of 14551 as the next level to watch.
Notable Names:
SQM is a chart I just wanted to point out tonight. People love to discuss buying dips, but few do it properly. Rather than just blindly buying into red, it’s best to wait for some stabilization and even a positive shift before getting long. This chart illustrates what can happen when looking to buy stocks simply on the basis of them being down, because downtrends can prevail and bring a world of hurt for the undisciplined.

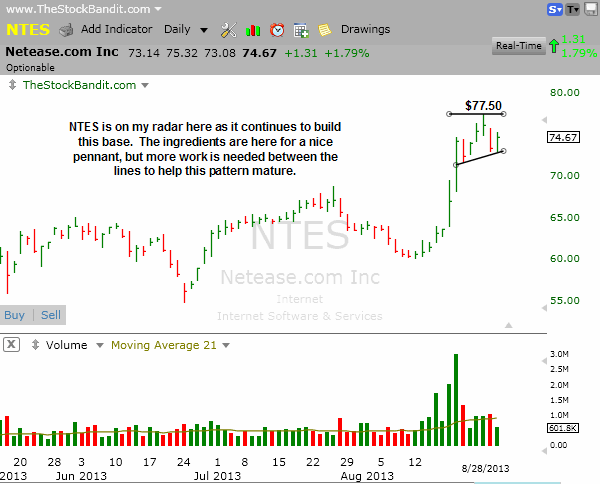
NTES is on my watch list but doesn’t look ready for a trade yet. I’d like to see this pattern build a bit more and price needs to challenge the high before I’d consider a trade. It has the right ingredients for a bull pennant but the base needs more work.
BIDU is another stock on my radar right now but also looks a bit shy of being ready to go. Price picked up today but still sits shy of the highs. Soon it could be a breakout candidate, just needs to firm up a bit more first.

REXX is also on my radar as it has held up relatively well in recent weeks and is currently just churning beneath a small trend line. That line sits near $21.30 tonight and descends daily. Today’s weak finish suggests it’s not quite ready, so I’m waiting.

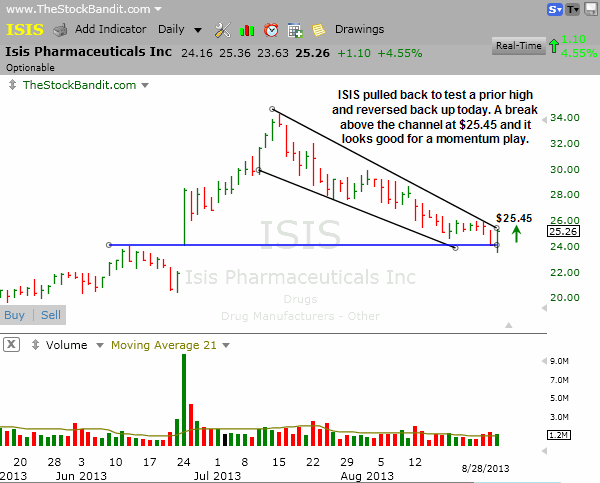
ISIS tested a key level today and broke it temporarily, then spiked higher. It’s now facing the upper channel line for a possible breakout. A swing stop would be too wide for my preference, so I like this one just for a single-day play if it can clear $25.45 to participate in the initial move higher.
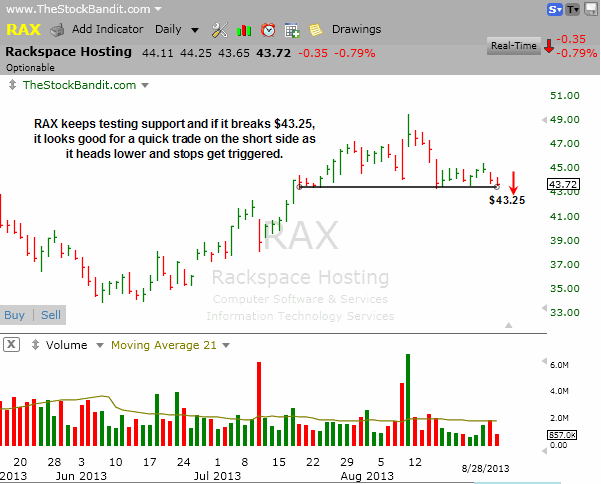
RAX is at multi-week support and a breakdown could trigger some stops to take out some hopeful longs. I’m looking to get short for a single-day play if it undercuts $43.25 to participate in the initial flush. This stock seems to move for only 1-3 days at a time, which is why I’m not considering a swing.
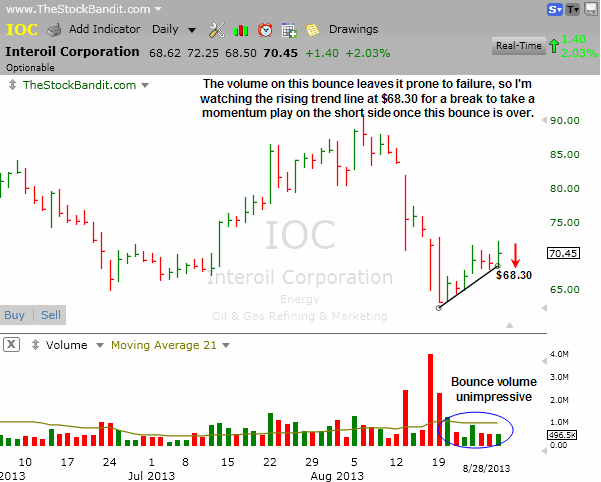
IOC is still bouncing from its low but volume isn’t confirming it. A break of rising support at $68.30 could prompt another round of selling, but this stock is a bit volatile for my taste as a swing so I’ll just take it as a single-day play if it undercuts that trend line.
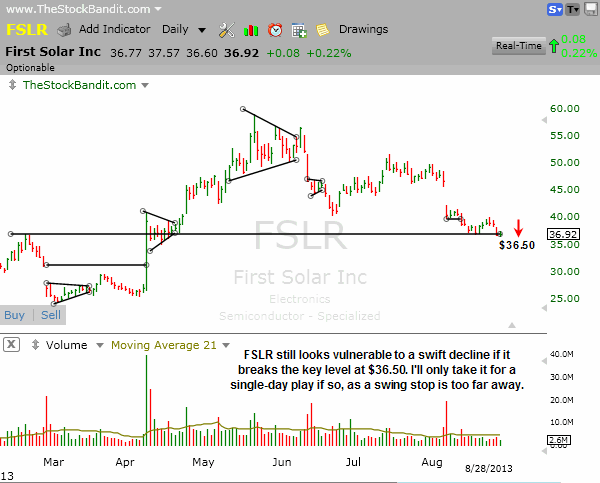
FSLR was listed here last night but didn’t quite trigger. It only gained 8 cents today, so the same setup is still valid here. I’m interested in participating in the initial breakdown through the $36.50 level, as it’s been respected for many months from both sides of the tape. There’s no nearby swing stop so I will not be taking it overnight.
New Swing Trade Candidates:
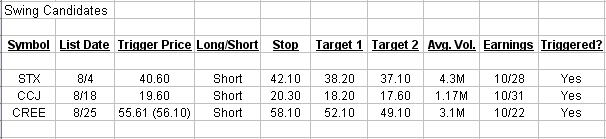
No new swing candidates tonight to add to existing inventory, waiting for new setups to surface.
Bullish Watch (click for charts)
Bearish Watch (click for charts)
Trade Like A Bandit!
Jeff


