


Good evening StockBandits!
The new week kicked off without excitement today as the major averages simply churned at their highs. The intraday action was uneventful with a NAZ trading range of less than 13 points and an S&P 500 range of less than 6. Needless to say, we never got far from the flat line and momentum was completely absent in the indexes. By the closing bell, we saw incremental gains for the NAZ and RUT, while the S&P and DJIA ended the day slightly lower. Are the dog days of summer finally here?
This is the kind of action we’ve been seeing since the late June low where we either rally or just move laterally – there seems to be almost no pullbacks these days. Rather than getting some healthy profit-taking after big surges, the market simply mark time moving laterally before lifting again. That doesn’t make it an easy environment to trade, but it’s what we have right now and at some point it will change.
I’m still finding plenty of bullish charts out there, along with a decent number of bearish setups. Given that the overall trend remains up, the long side is the one I want to be primarily positioned in. However, there are some weak stocks out there which are offering some potential for shorts, and that also can serve as a natural hedge against longs should we happen to get some selling one of these days.
At the moment, this would be a great spot for the NAZ in particular to put in some rest, as it has run a bit hot of late. The others aren’t in need of basing like the NAZ is, but the bulls are running the tables right now and haven’t yet given indication that they’re ready for a break. This is a time to stay opportunistic and trade with the trend, but we can’t ignore the growing risk of a pullback because it’s been a long time since we last had one.
** I will be on vacation from tomorrow until next Monday, August 12th. That means there will be no nightly reports during this time or site updates. This will be my 2nd week of vacation for 2013, and I am looking forward to the downtime to recharge and gear up for the remainder of the year. As such, my focus tonight will be on highlighting the best charts to keep an eye on for the next few days in my absence.
Let’s get to the charts.
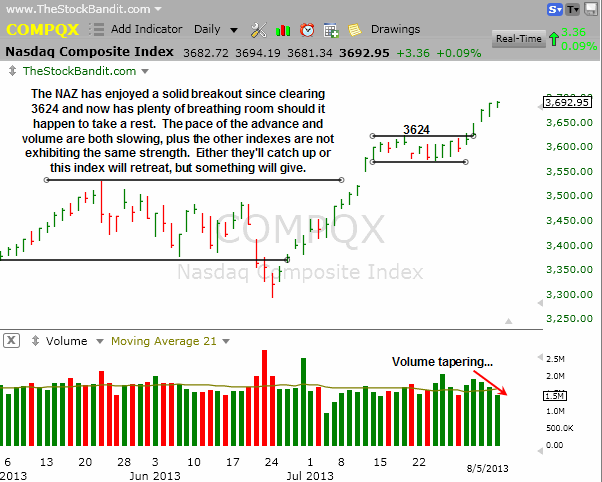
NAZ – The NAZ is at levels not seen since the fall of 2000, which really is saying something considering we began the year in the 2900’s. This index has shown exceptional strength not only since the June low, but even in the past week with a solid breakout from the high bull flag pattern I have been highlighting. Volume is slowing and so is the pace here, suggesting it may be time for a breather.
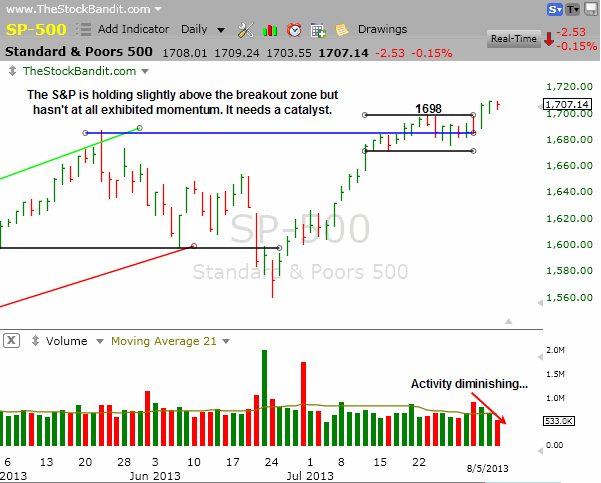
SP500 – The S&P hasn’t created much space between current prices and the 1698 resistance level it was facing before last week’s breakout. This lack of momentum after clearing an important level is not yet a major concern but it’s certainly something to closely monitor here simply due to the chances of a breakout failure with any move back below 1698.
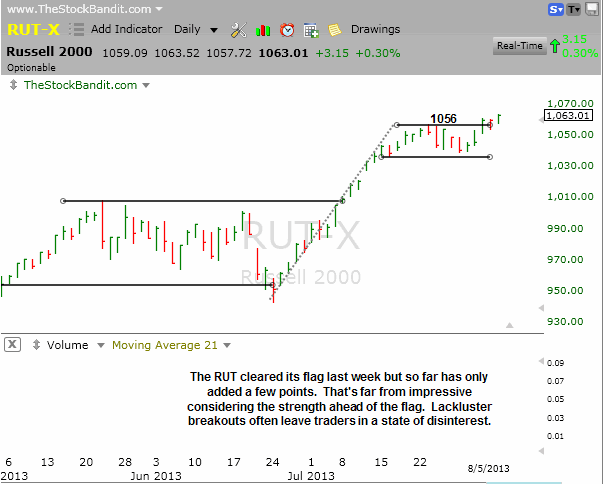
RUT – The RUT cleared 1056 last week and has held above it, but still hasn’t gotten far. Tonight it’s just 6 points above that level. It is at all-time highs so I don’t want to discount the importance of that, but this has been a bit of a sluggish breakout so far.
DJIA – The DJIA remains stuck in the 15600 neighborhood and so far just can’t seem to free itself from this high consolidation area. This index is also sitting at all-time highs, which Main Street loves to hear on the evening news. However, momentum has dried up in the past few weeks so a catalyst is needed.

Notable Names:
These stocks belong at the top of the watch list over the coming few days while I’m out.
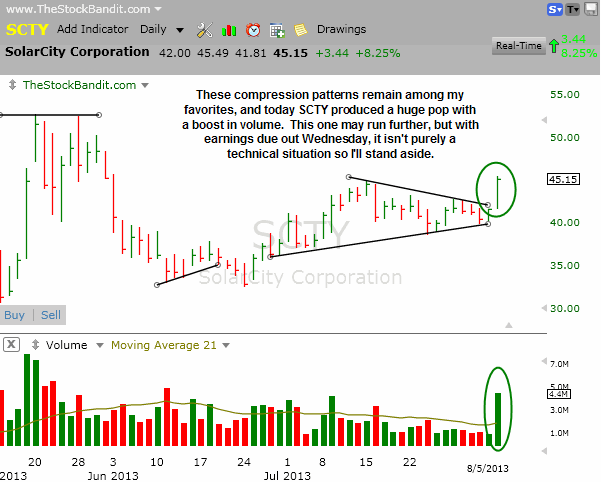
SCTY was listed here last night for a momentum play above $42.25. Today it ripped higher by $3.29 after clearing that level, providing an excellent intraday play for those who are more active. Earnings are due out Wednesday though, which is why it was not listed as a multi-day swing.
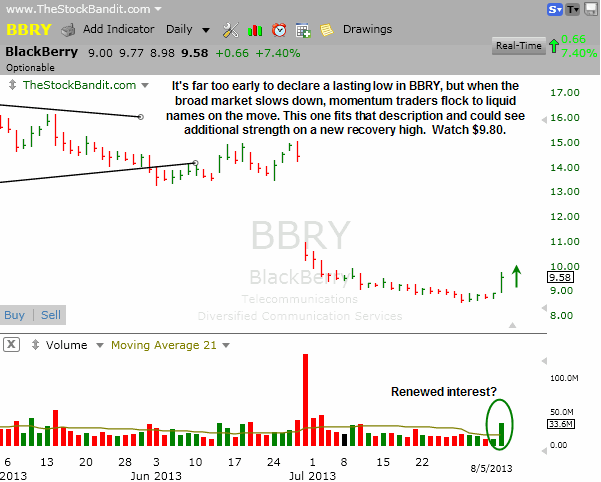
BBRY has been out of favor for some time now, and today suddenly sprang to life on strong volume. I don’t know that it’s time to call a bottom, but I do know that in sluggish markets like we saw today that active traders will head to names with liquidity and activity, so this could see additional interest over the next couple of days as well.
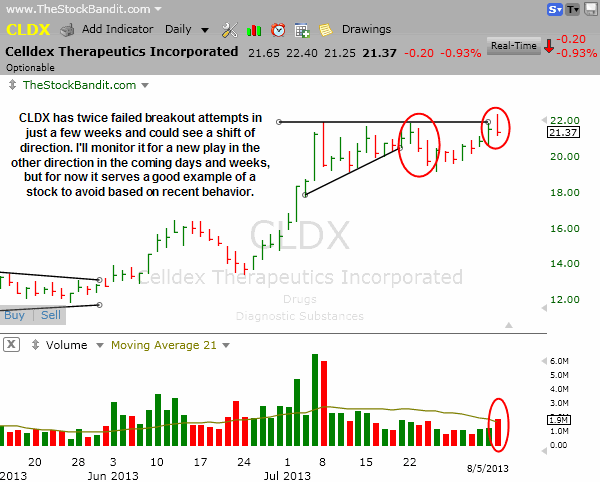
CLDX is a good example of a stock that’s just struggling to confirm patterns. It has twice failed to clear resistance in just a few weeks and when I see that happen, it’s often a sign to leave it alone.
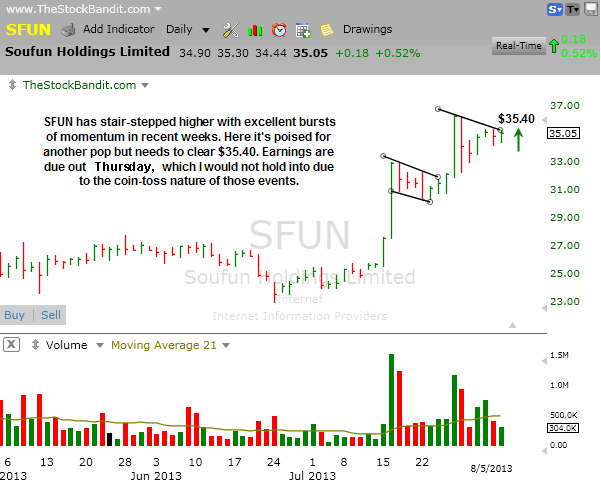
SFUN is looking ripe for another rally here but earnings are due out in just a couple more days. A push through $35.40 sets it free to run, but this is the kind of play to keep it quick since fundamental news is right around the corner.
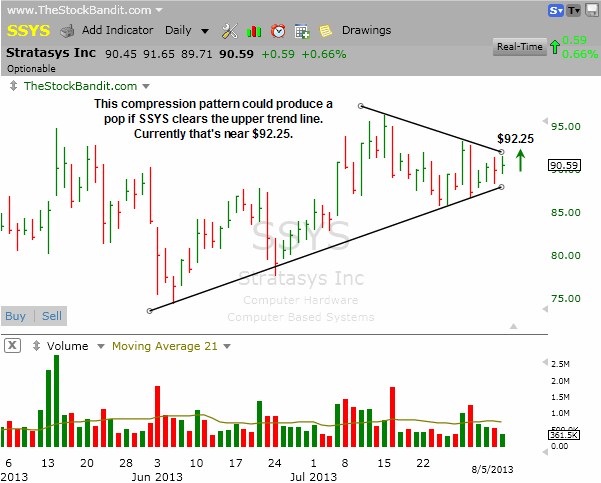
SSYS is getting closer to the apex of this wedge or triangle pattern and could start to see better momentum once it exits this compression pattern. The upper trend line is at $92.25 and descends daily, and that’s the level to watch.
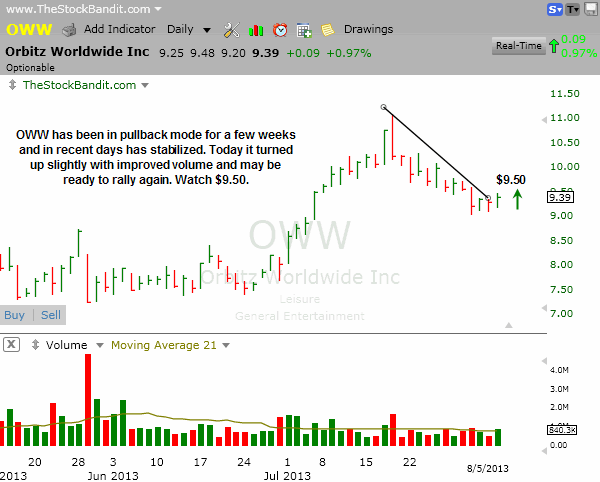
OWW is trying to show some short-term character improvement with a few days of lateral price action and a little greater activity alongside today’s minor advance. Some follow through to a multi-day high could generate more interest above $9.50.
AEGR is at trend line resistance after lots of recent strength and a turn higher through $94 would signal the end of this short-term rest phase. Watch for volume expansion along with a turn higher in price.

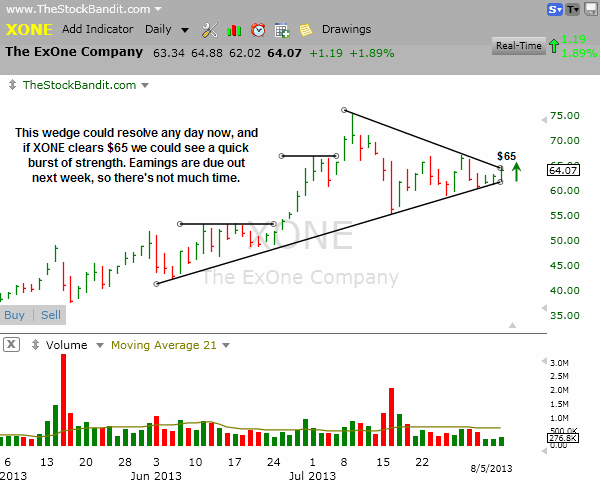
XONE is at the upper trend line of this large wedge and a push through $65 could trigger some momentum on the upside. Earnings are due out on the 13th according to Yahoo! Finance. That doesn’t give it much time to run, and with me going on vacation I won’t be posting updates on a stop or else I’d set it up as a swing. It is a nice setup and these compression patterns often generate explosive exit moves. Other 3D printer stocks to watch with it include SSYS and DDD.
LITB is turning back up here toward upper resistance and perhaps the 4th time will be the charm. A breakout happens at $18.30, making this one to put on the radar over the next couple of days.

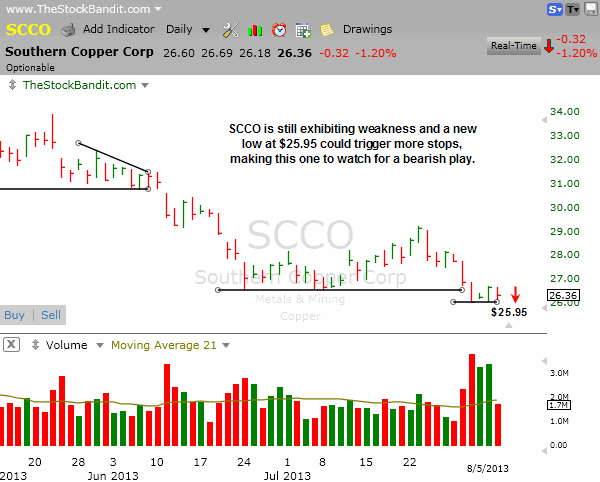
SCCO is struggling to bounce and has simply moved sideways over the past few days since its most recent decline. A new low at $25.95 sets up another shorting opportunity as more longs get stopped out and the downtrend continues.
New Swing Trade Candidates:
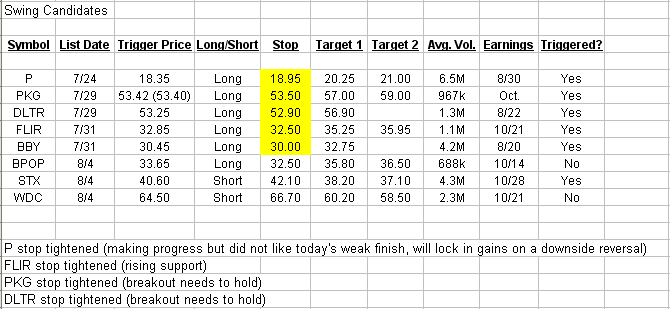
No new swing candidates added tonight. There are 2 which have not yet triggered, and otherwise on an overnight basis I’ll be sticking with existing positions.
Bullish Watch (click for charts)
Bearish Watch (click for charts)
See you Monday the 12th with the next report!
Trade Like A Bandit!
Jeff


