


Good evening StockBandits!
The market gapped higher this morning in response to Larry Summers’ withdrawal from consideration as the next Chairman of the FOMC, giving the bulls something they felt was worth celebrating. The early enthusiasm waned quickly, however, as prices had become extended with the morning strength putting the market on track to go 11 for 13.
With the S&P having reached key resistance and the Wednesday Fed meeting coming into view, some steady profit-taking kicked in and cooler heads prevailed. Stocks retreated from their opening highs with the NAZ actually filling the entire gap and finishing negative. It wasn’t quite the May 22nd type of reversal, but it certainly pointed to some fatigue on the part of the bulls who are now looking winded.
For now, a trading range remains intact for the DJIA and S&P 500, while the NAZ and RUT have each just carved out some new highs with today’s bar. Across the board, the indexes appear to be showing some signs of fatigue after a very significant rally off the late August pullback lows and could finally be set to rest. As attention shifts to Wednesday’s FOMC event, we could see some quieter action on the heels of today’s volatility, but anything remains possible. I’m staying light and considering plays on both sides of the tape as they emerge.
Let’s get to the charts.
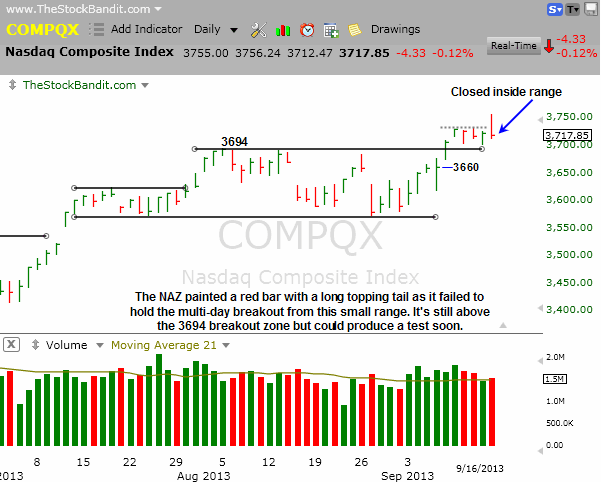
NAZ – The NAZ saw a new multi-day high today on the open, moved just 1 point higher to mark the peak of the session, then retreated to finish just 5 points off its low and back inside the multi-day trading range. Price is still above the breakout zone of 3694, but not by much.
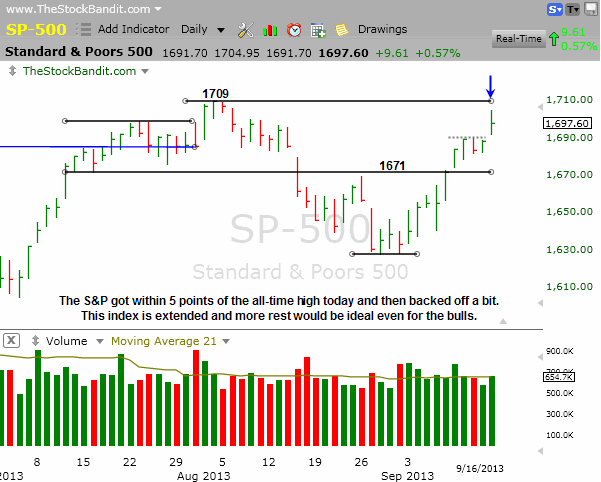
SP500 – The S&P moved to a new recovery high since the late August low, getting to within just 5 points of 1709 where it topped last month. It backed away from that area and currently is in no-man’s land here with price looking extended but room both ways before a meaningful technical development would occur.
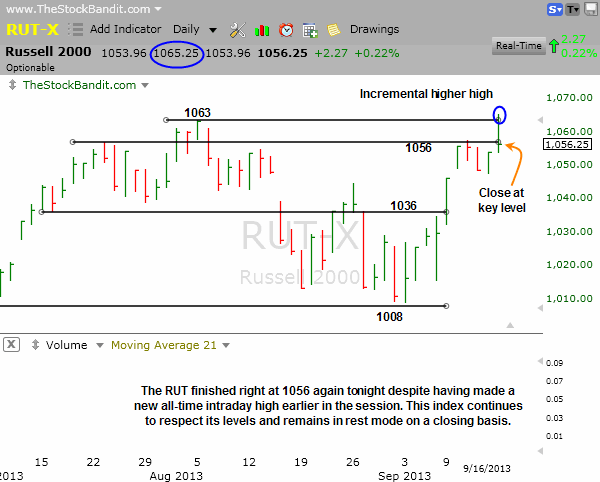
RUT – The RUT made an incremental new intraday high today but finished near the low of the day and right back at the 1056 level I keep highlighting. This is clearly an important zone, and the next few sessions could set the pace for the next several weeks as we see a showdown here near the highs.
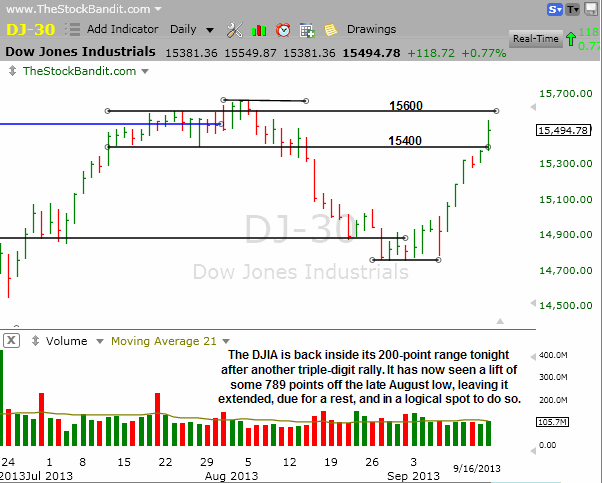
DJIA – The DJIA reclaimed 15400 today and pushed a bit higher, closing right in the center of the 15400-15600 range from July and August. This index needs to pause after this big lift, and this is a logical spot for it to do so.
Notable Names:
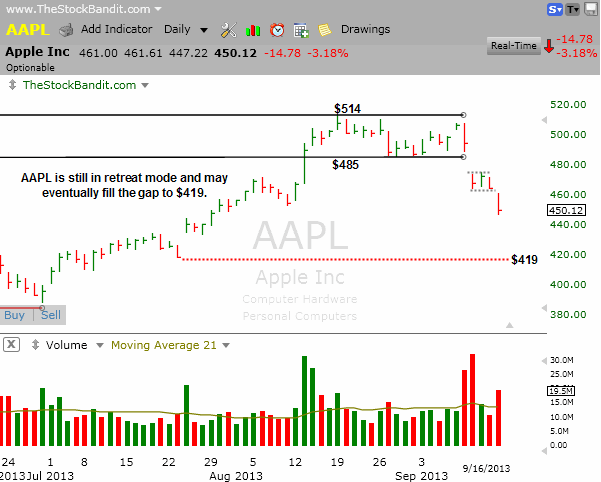
AAPL weighed on the NAZ today and still hasn’t stabilized since the big conference on Sept. 10 left the Street unimpressed with the new iPhones. There is a gap down to $419 that it may get to before this is all said and done. Best to let the pullback run its course even if you are a believer in this stock, as there’s just no interest in it right now and being early with an attempt at a dip buy can quickly equate to pain.
DIS is a Dow component and today got to within just a few cents from key resistance and then reversed to finish just 6c off its low. This stock has rallied very sharply with a streak of 10 consecutive advances (and 12 of the last 13) and now needs to digest this move as today’s retreat looked like basic fatigue.

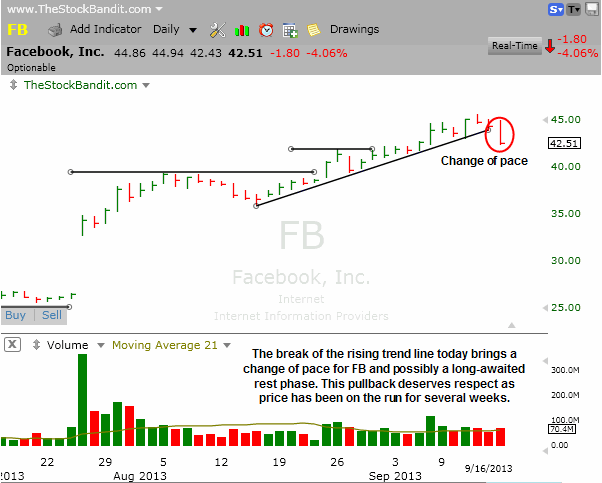
FB has been in rally mode with a steady uptrend the past few weeks but today that got interrupted with a trend line break and a finish right near the low of the day. This isn’t necessarily the end of the uptrend, but it’s a definite change of pace and that’s not something to ignore. Short-term longs should be out with a bar like this.
TSLA is still churning here not far from its highs. A new high could set it free to run again, but for now it’s one to keep on watch.

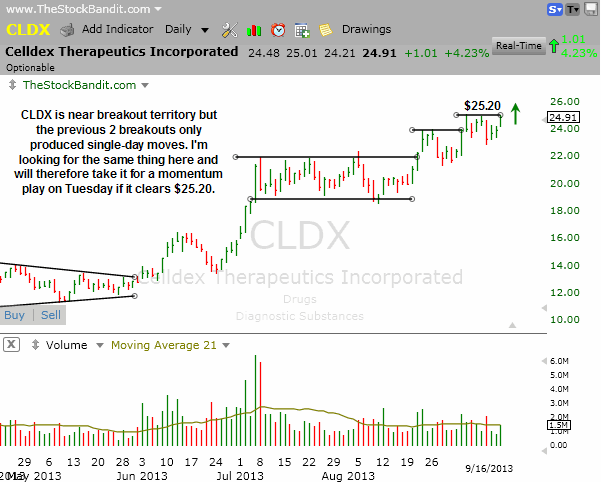
CLDX has had a history of recent 1-day moves past lateral resistance so that’s all I’m looking for here. If it can clear $25.20 on Tuesday, I like it for a momentum play to participate in the initial breakout move but nothing more.
TEAR is getting compressed here between two trend lines and if they can tighten further I’d consider it for a swing. However, should this one happen to clear $13 on Tuesday, it looks good for a single-day play on the long side to participate in the initial turn higher. A tighter pattern would set up a better swing scenario simply due to the narrower stop it would entail.

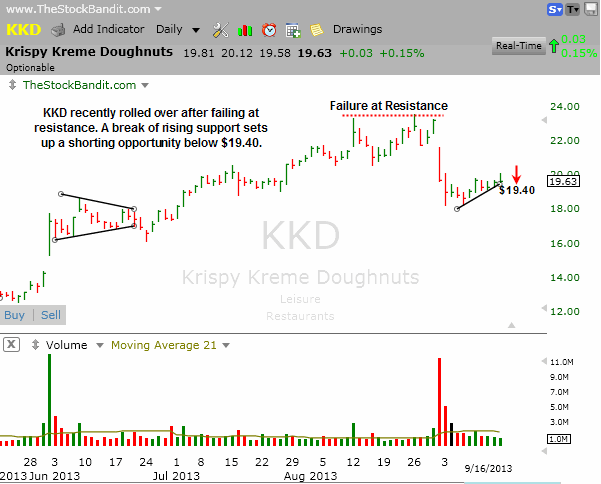
KKD is hugging short-term rising support here and a break below $19.40 looks good for a quick short sale. The last turn lower was a very swift one, so I’m simply aiming to participate in the initial break here and will not be holding overnight.
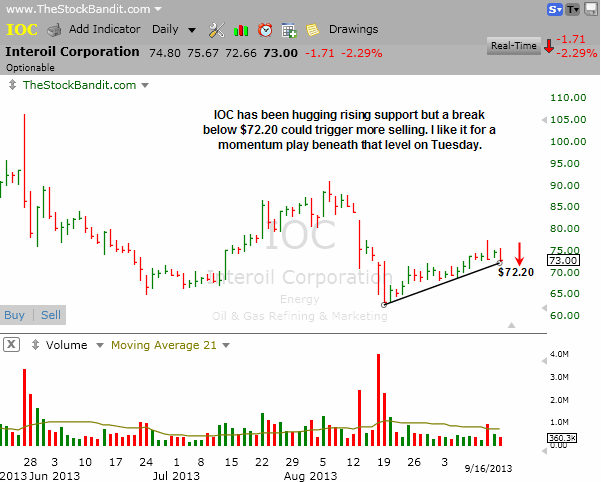
IOC is at rising support after a few weeks of quiet rallying from the low. A turn lower could be met with another swift decline similar to the one in August. A break below $72.20 and I’ll grab it for a single-day play as a swing stop belongs above the bounce high from last week and that’s just too far for my preference.
New Swing Trade Candidates:
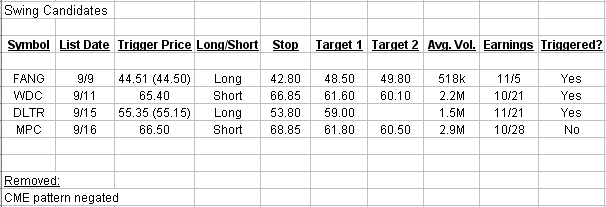
These stocks look ready for imminent multi-day moves. Pattern confirmation occurs with a move through the entry level. Initial stop and target levels are also provided.
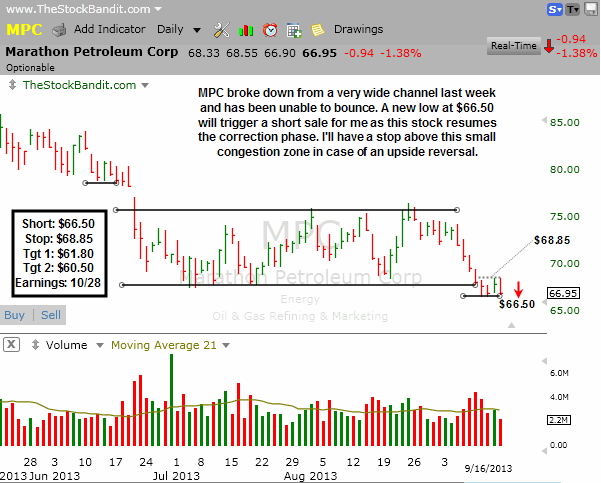
MPC is basing here at the lows and a break beneath $66.50 will trigger a short sale for me as a swing trade. The channel it just left is about $8 from low to high, so I’m essentially looking for that to eventually play out with my final target. I’ll have a protective buy stop in case this triggers an entry and reverses higher, but overall this pattern appears bearish so I’m giving it a shot. My first target area is a bit more conservative at the congestion zone from December/January.
Bullish Watch (click for charts)
Bearish Watch (click for charts)
Trade Like A Bandit!
Jeff


