


A much-needed pullback finally arrived last week, but it stayed mild and didn’t change the bulls’ position of power. The trends are still up and levels were defended on the dip. Just how long the rest lasts, we’ll have to see, but it’s a well-deserved pause after considerable strength.
As we head into a new week of trading, it’s time once again to take a look at the indexes and the key levels they’re dealing with. This will impact how individual names move, so it’s where every new trading week should begin.
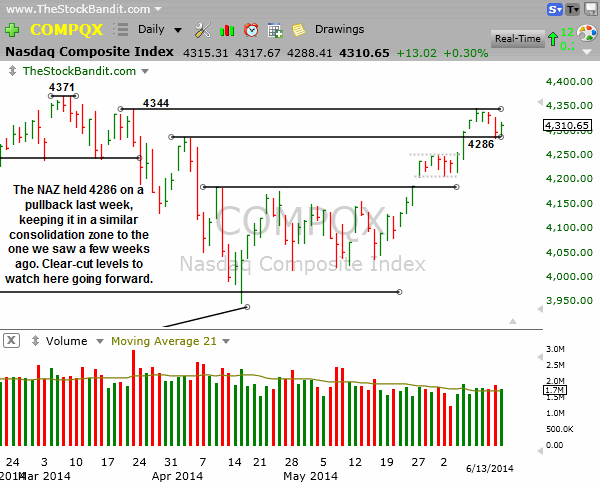
NAZ – The NAZ has settled into a similar short-term base to the one we saw from late-May into the first few days of June. Price is caught between a pair of levels at 4286 and 4344, and each day spent inside the range will be of benefit to digest the recent lift.
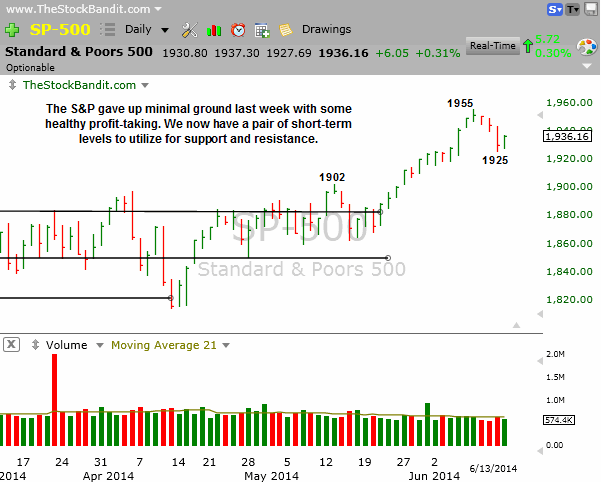
SP500 – The S&P put together three consecutive declines last week for the first time in over 2 months. The early-June congestion area was tested and we saw a modest bounce Friday to stop the bleeding. There’s still lots of room for a decline in this index before it would do any technical damage, but it will head into Monday just 19 points off the all-time high.
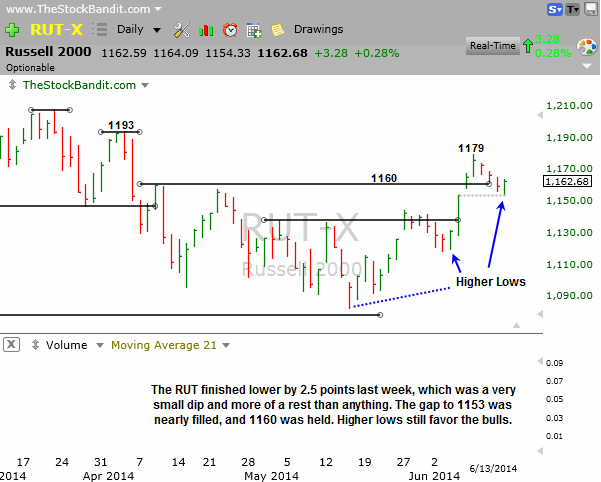
RUT – The RUT pulled back to test 1160 last week and held, thanks to an upside reversal in Friday’s session. 1179 is the next upside level to watch, followed by 1193, two prior bounce highs. The best thing going for this index is the pair of higher lows it currently has in place which headline the technical improvement of the past few weeks.
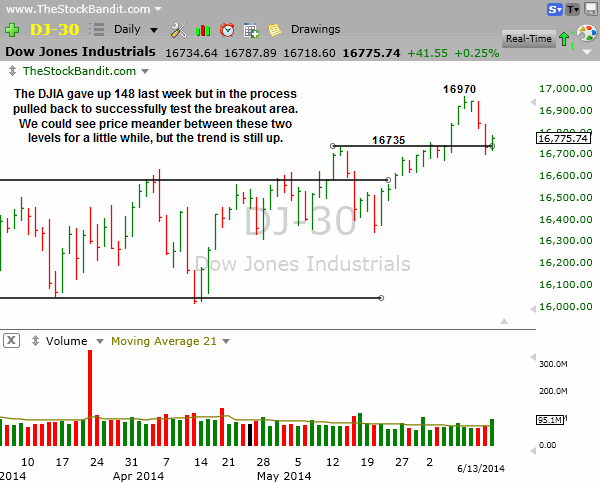
DJIA – The DJIA gave up a little ground last week en route to a pullback test of the 16735 breakout zone. Price got slightly beneath it but reclaimed it by Friday’s closing bell, leaving it looking like a successful test has occurred. We’ll see if it can hold, but so far, so good for the bulls.
Trade Like a Bandit!
Jeff White
Take a trial to the Stock Pick Service to get my trades.
Follow @TheStockBandit on Twitter


Thanks for doing and sharing these levels with us every week Jeff. I appreciate your work and hope you had a great Father’s Day.
Sam, very nice of you to tell me this – thank you! I’m glad you find it useful and your taking the time to post this means a lot. Go get ’em this week!