The lower high I discussed in the index review two weeks ago was confirmed last week as post-FOMC selling pressure left the indexes undercutting support zones in a swift decline. We’ve been cautious and biased to the short side lately inside the member area, and that has served us well. Now, we need to wait for a bounce back to reload shorts, as trapped bulls will very likely be using any strength from here to raise cash.
As we head into a new week of trading, it’s time once again to take a look at the indexes and the key levels they’re dealing with. This will impact how individual names move, so it’s where every new trading week begins.
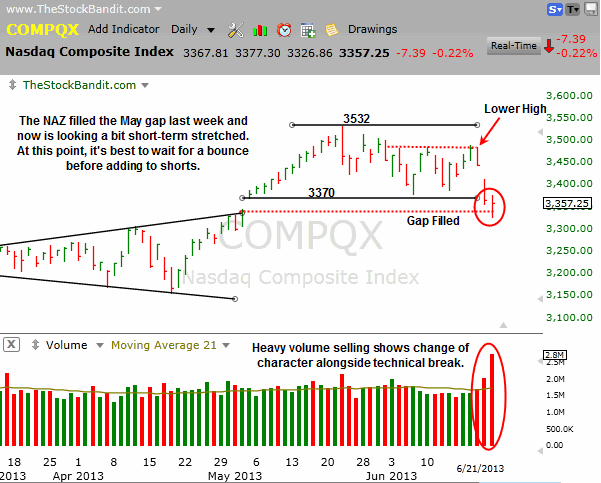
NAZ – The NAZ broke 3370 on Friday, filled the May gap, and then attempted to rebound from its lows after becoming short-term stretched yet was unable to go green on the session. The gap fill completed some unfinished business for this index, and now it’s just a matter of how far the initial bounce carries. Any stalled-out price action will likely invite more selling, reminding those who haven’t raised cash yet that it’s not too late. Just look back 2 years for a reminder of how quickly a market can crumble.
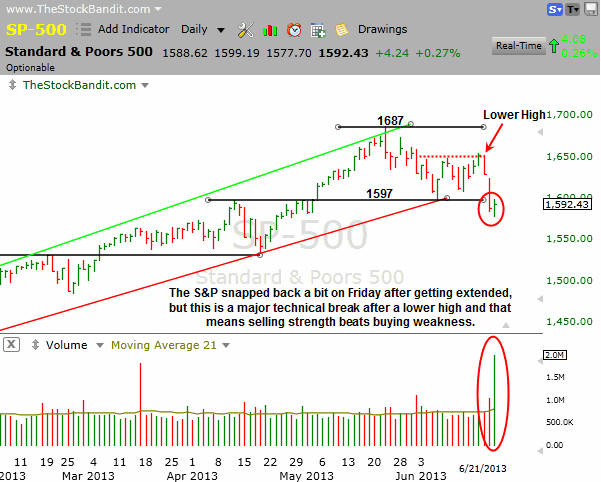
SP500 – The S&P broke below its uptrend channel and lateral support at 1597 to test some late-April support at 1577 before rebounding a bit on Friday afternoon. Interestingly, it couldn’t reclaim the 1597 level on a closing basis Friday after lifting just beyond that level in the final hour of trading. This is a major technical break and should not be viewed at this point as any old dip to buy. It just confirmed a lower high and that should not be taken lightly.
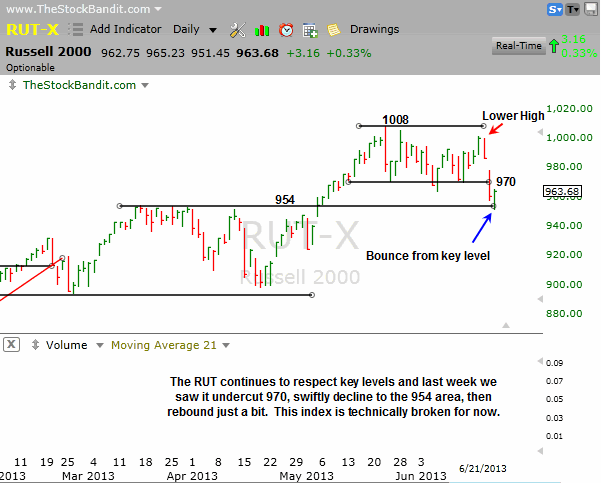
RUT – The RUT undercut 970 last week and retreated immediately to the 954 area I’ve highlighted here numerous times. It was able to bounce back a bit on Friday, but isn’t trustworthy after this hard breakdown. Next level to watch is the unfilled gap to the 940 area from the close on May 2nd.
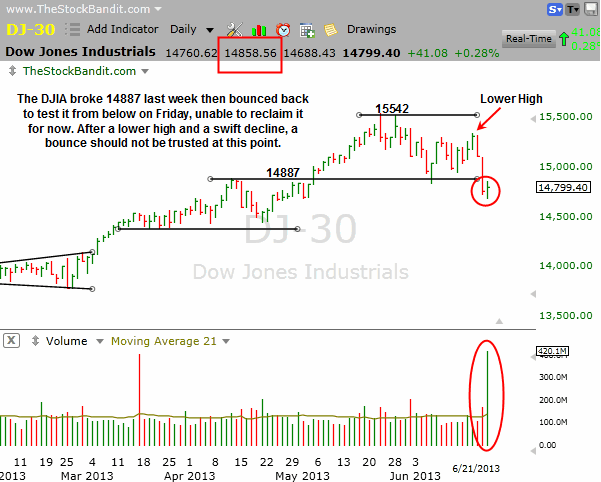
DJIA – The DJIA rebounded last week to test the 15300 area, but couldn’t hold it and quickly sold off hard. The subsequent break of 14887 was met with an additional decline to 14688 before a Friday afternoon bounce took it back up toward broken support where it currently stands. This index just confirmed a lower high (15340 vs. 15542) so the current bounce may not last long beyond the initial snap back.
Take a trial to our Stock Pick Service to get our trades.
Trade Like a Bandit!
Jeff White


