


Good evening StockBandits!
The tone shifted last week a bit as we saw each of the major averages give up some ground. The previous week, I was discussing the standout fact that the RUT was not reaching new highs like the other averages, despite leading the way throughout the current rally. Last week we saw that index retreat to 4.7% off its highs, while the others followed suit. The DJIA actually held up best with a slim 13-point decline, while the S&P 500 and NAZ gave up 1% and 2%, respectively.
The selling carried over into the early action on Friday as North Korea tensions mounted and a disappointing jobs report hit the wires. That produced a hefty downside gap, but the lows of the day were set very early in the session and between the bells we actually saw a steady recovery effort for the remainder of the day. Whether that’s short-covering into a quick selloff or bulls stepping in to defend the market we don’t know yet, which means the real test may come this week. It could be shaping up as a pretty good battle between bulls and bears as the former camp seeks to retain control and the latter group aims to have their day in the sun after several months of misery.
In the near term, this shake-up has certainly disturbed a great number of charts which were humming along pretty quietly with uptrends. Some stocks have drastically changed character in just the last few days, which for the moment makes for some messy charts. However, in the days ahead we’ll either see new downtrends starting to surface or new leaders emerge on the upside, so there should be some good opportunities. At the very least, we are getting more levels to trade against in the days ahead as support and resistance zones. I’m down to just 3 open swing positions, but will be looking to add exposure going forward as quality setups with favorable risk/reward scenarios come to light.
With earnings season upon us, now is a good time to remember that it’s important to check the earnings calendars when considering holding positions overnight. Because so many companies report in the pre-market or after hours, it’s critical to knowing when those reports are coming in order to avoid any big surprises. I use EarningsWhispers and Yahoo! Finance as my primary earnings calendars, so they’re great sites to bookmark as quarterly reports start rolling in.
Let’s get to the charts.
NAZ – The NAZ gave up 2% on the week to fill the gap from early March and then narrowly hold the 3200 level by the closing bell on Friday. This index saw a 1% lift off the low of the day, but is acting heavy and just failed a breakout. That places great importance on the coming few days as we see if the bulls will defend or if the bears instead can build on their win last week.

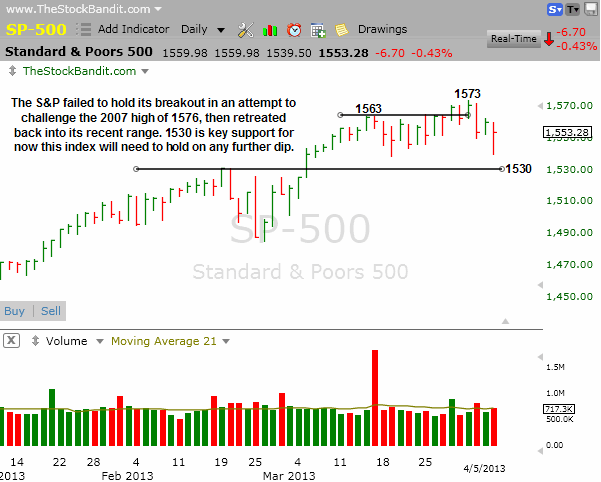
SP500 – The S&P shed 1% last week but held above the 1530 level. It’s currently 20 points shy of last week’s high, and 23 points shy of the all-time high of 1576 from 2007. The trading range remains intact after the breakout failure, so we continue to wait for a decisive move.
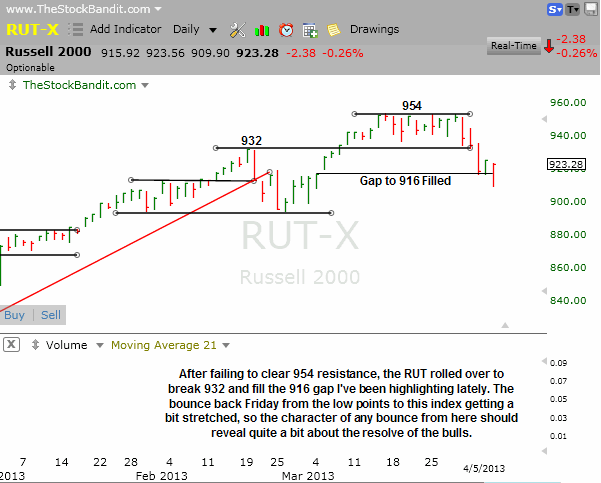
RUT – The RUT remains the weakest of the bunch after a 4.7% retreat from its high. It filled the gap to 916 and then bounced back from its low on Friday, yet remains beneath 932 which was former resistance turned support until last week.
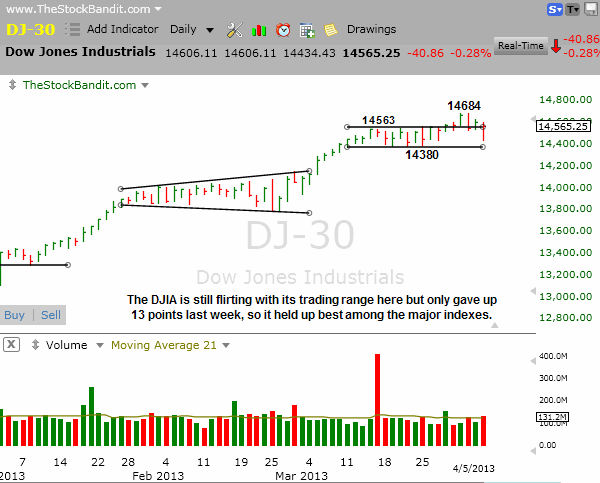
DJIA – The DJIA is only a short distance off its high and was able to lift enough Friday to finish a couple points above the trading range to narrowly hold the breakout. Main Street remains enthusiastic about the recent milestones of late, although the other averages will in all likelihood hold the real key for this market.
Notable Names:
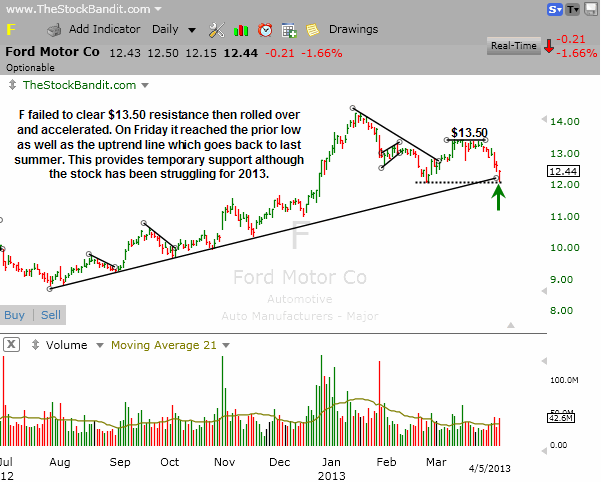
F found support at the longer-term uptrend line as well as lateral support from February on Friday to prevent an all-out breakdown. Since rolling over away from resistance in recent weeks, that leaves this stock range-bound.
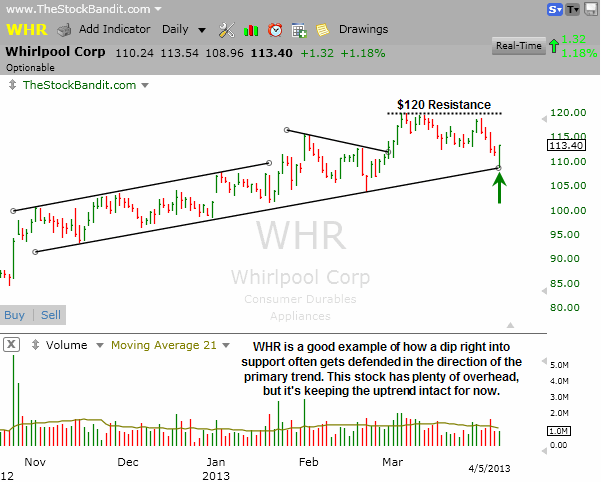
WHR is another stock which found uptrend support on Friday after a multi-day pullback and a downside gap. It remains beneath key resistance, but has a chance to stabilize here. Another test of the primary uptrend line may put this stock in a much more defensive position after the short-term lower high was established last week.
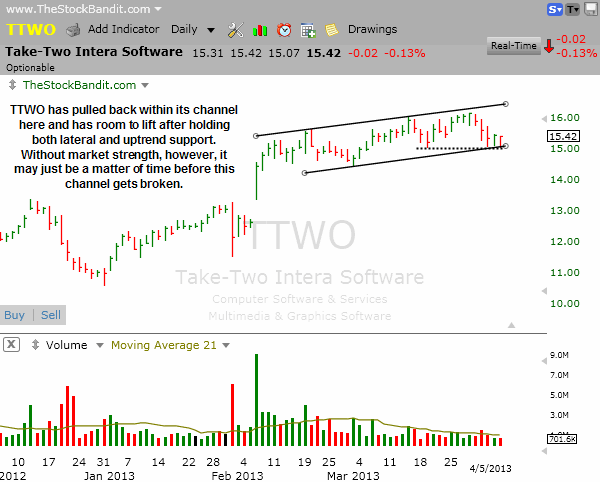
TTWO is narrowly holding within its uptrend channel here and has about $1 of upside room before it would challenge the upper channel trend line. Being that rising support coincides with lateral support (dashed line), a breakdown from this area would instead be very bearish for this stock.
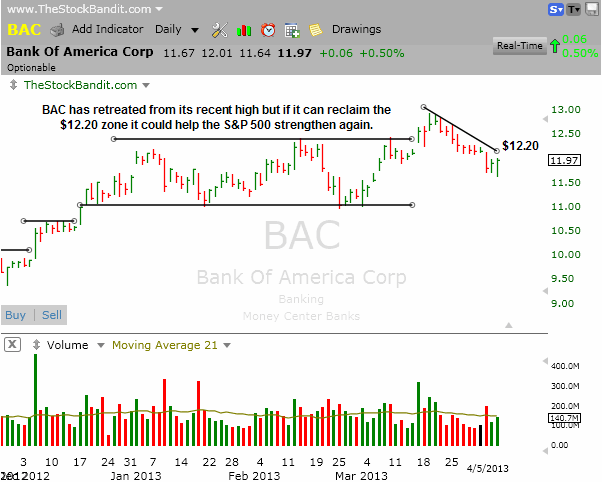
BAC is one of many financial names which have struggled of late, providing zero help to the S&P 500. After this 3-week pullback, a turn up through the descending trend line could help out the sector as well as the S&P, but for now it’s still trying to find its footing.
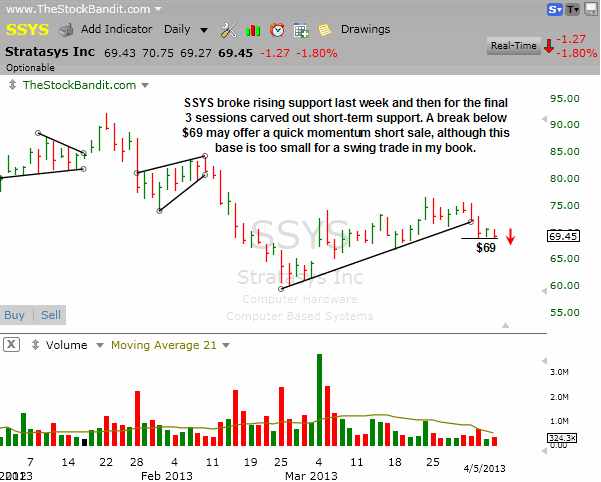
SSYS is holding above 3-day support here but just broke a key uptrend line which has been providing support since February. This one still looks vulnerable to a further decline, and a break below $69 could provide a nice momentum play on the short side. However, for a swing trade, this base is just too small so I won’t be taking this one as a swing.
New Swing Trade Candidates:
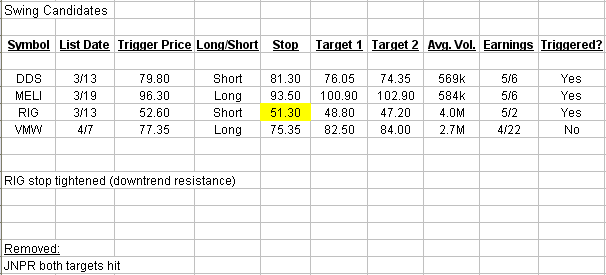
These stocks look ready for imminent multi-day moves. Pattern confirmation occurs with a move through the entry level. Initial stop and target levels are also provided.
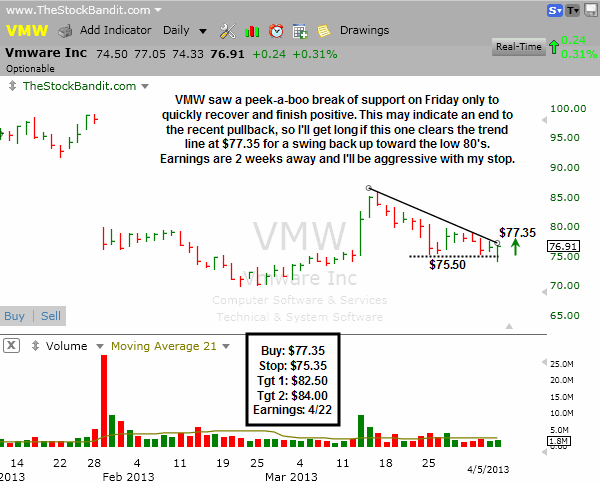
VMW has been stabilizing for two weeks and on Friday we saw a headfake break of support as the $75.50 level was undercut and then quickly reclaimed on a closing basis. This stock is now challenging the descending trend line, and a push through $77.35 paves the way for a lift. I’ll get long there and will set my stop beneath support but will aggressively raise it as earnings draw closer on April 22nd.
Bullish Watch (click for charts)
Bearish Watch (click for charts)
Trade Like A Bandit!
Jeff



jeff
I wonder…..you’re about 50%. Meaning about half your ideas work out. Have you ever logged results based on specific trading patterns. Aren’t some producing better than others (statistically)?
Thanks
John
Hi John,
This is a great question and yes you’re right…my accuracy isn’t going to impress anyone. Thank goodness that profitable trading doesn’t require that!
It seems like compiling stats on particular patterns would yield some insights, but quite honestly they are so dependent upon market conditions that the data itself wouldn’t reveal enough of value to place any weight on it. So to answer your question, I have not compiled stats to that effect.
For example, take a bull flag. In a strong market, those will work better than in a range-bound market. How would you account for that in the stats, as the general conditions carry considerable weight in how well a pattern like that will play out on average?
I just have found that experience helps a trader understand when to start applying different patterns due to more frequent failures of recent trades. Something is usually working (although there are occasions when we’re truly directionless). It’s a matter of finding out what is working and how to locate those plays and structure them accordingly, so I think the science of data still would have to go hand-in-hand with the art of adaptation.