TheStockBandit.com

Swing Trading and momentum investing stock pick newsletter and swing trading service.

  • Home
    • Blog Archives
    • Blog Categories
  • About
    • About The Stock Bandit
    • FAQ
    • Contact Us
  • Strategy
    • Join the Email List!
    • Stock Trading Methodology
    • Trading Rules
    • Chart Patterns
  • Products
    • Products Overview
    • Trading Courses
    • Stock Pick Service
    • Recent Trades
    • Trader Coaching
    • Seminar DVD’s
  • Subscription Info

I Like This Channel Play

June 27, 2012 By Jeff White Filed Under: Position Trades

F is caught in a trading range at the moment, which is not much different from the one which lasted nearly 3 months earlier this year.  The previous range was from $12-13, whereas the current range is from $10-11.  I also like the fact that the current range is less than 2 months old.  There are no guarantees this one will continue, but it’s not uncommon to see patterns mimic previous patterns from recent weeks or months.

That said, I’m getting long some F here off support (long from $10.02).  I’ll be stopping out below $9.80 and am looking for a lift up toward $10.75.  I like the risk/reward for a trade given this range and the personality of this stock.

This is a position trade and not a swing trade, which is why it is not listed on the Trades Overview grid (as those are shorter-term swing trades).  I just wanted to share with you this setup and my plan for the position.  Earnings appear to be tentatively set for July 27th, although that is not confirmed.  I’ll look to exit prior to that event, and will follow up with any additional notes via the comments section for this post.  Here’s a chart:

Why I Use TC2000


Trade Like A Bandit!

Jeff

ETF Positon Trade Setup

January 9, 2012 By Jeff White Filed Under: Position Trades

I don’t trade most ETF’s very actively.  A few of them I’ll day trade (SPY, IWM, QQQ), but many others I’d just rather not be real active in them.  That doesn’t mean they don’t have potential though, so what I’ll typically do instead is to trade them via longer-term accounts (in this case IRA) as position trades.

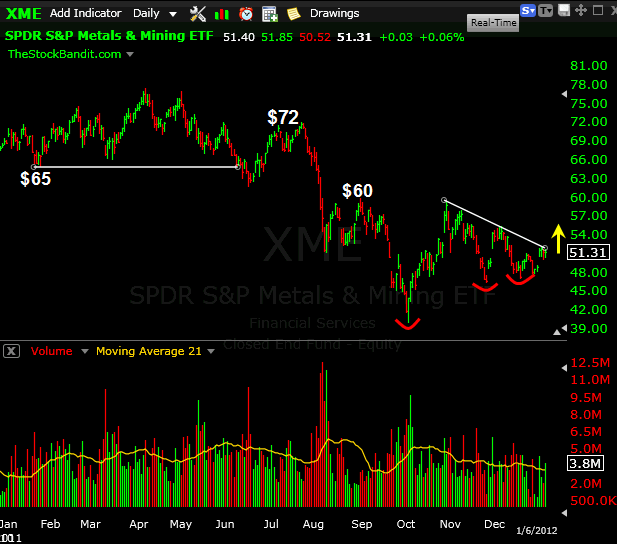
One setup I’m looking at right now is XME, which is the Metals & Mining ETF.  It’s been moving somewhat constructively since bottoming in October, and over the last two months it has pulled back quietly to base in a wedge-like pattern.  During that time we’ve seen both lower highs and higher lows established.  A push through the white trend line would take place around $52.20, and could see this sector ETF working its way back up toward higher levels which it previously respected as either support or resistance over the past year.

My plan is to get long if it crosses the trend line, and I’ll be looking for a position trade over the coming months here (hence I will not frequently be updating this trade).  Gap risk is greatly reduced since it’s an ETF, so I don’t mind the longer holding time.  I’ll look to stop out if it closes under $47, but otherwise will be looking for an eventual advance back toward the $72 area from July.  I also expect to sell calls on rallies in order to collect some premium if/when the stock becomes a bit short-term extended.

Here’s a closer look at the chart of XME outlining the recent higher lows as well as some upside levels I think the stock could be heading toward if it clears the descending trend line with a push through $52.20:

Why I Use TeleChart


Just wanted to share this chart with you and my plan for this IRA trade.

Trade Like A Bandit!

Jeff

Burrito Time!

January 3, 2012 By Jeff White Filed Under: Position Trades

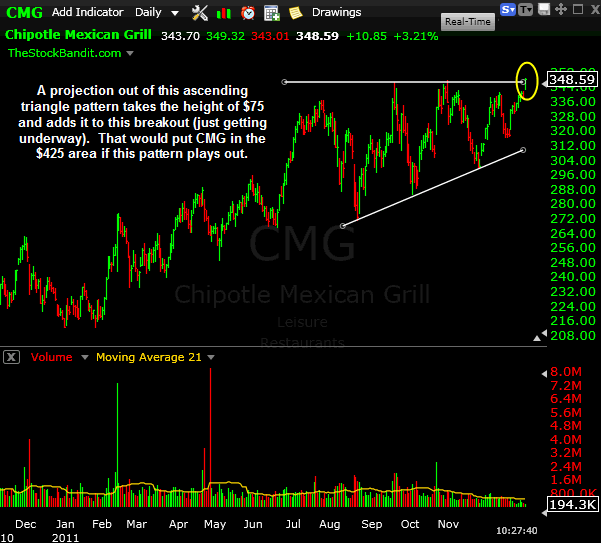
Don’t look now, but CMG is back on the move – and potentially in a very big way. The chart below outlines the large, multi-month ascending triangle that’s been forming, and currently we’re seeing a breakout attempt in the stock.

But can it stick?

That’s always the million-dollar question, but with a solid uptrend in place and prices now pushing to new highs, I certainly wouldn’t bet against it. In fact, I like it for a push to the $425 area, which is the projection of this pattern (add widest portion of triangle to breakout zone).

Here’s a closer look at the chart:

Why I Use TeleChart

An aggressive stop would be a gap fill to the 12/30 close of $337. Nice setup, and this is the kind of play I’d consider not for a swing but rather for a position trade, as I would expect it to take more than a couple of weeks to achieve the target.

Trade Like a Bandit!

Jeff

Position Trading Candidate 5-31-2011

May 31, 2011 By Jeff White Filed Under: Position Trades

Hope your Tuesday’s going well StockBandits!

You’re used to seeing short-term trade ideas presented here, whether they are day trades or swing trades, but periodically I do put on positions which are intended to last longer. I typically don’t involve them in my main trading account, and instead leave them for my IRA.  These position trades are generally a bit slower-moving, meaning I don’t expect to monitor them real closely and they are likely to last at least several weeks.  I’ll be presenting these here periodically as they emerge.

Since these plays are longer-term positions and not ‘trades’ as typically defined here, they are not posted to the Hit List.  These are additional, longer-term ideas which are shared for your benefit.  I don’t at all mind updating the status of them or conversing (in the comments below) about how they’re behaving, but they will not get my daily attention and will not be updated regularly as such.

Now for the play…

Fads come and go, but some things are cool enough to outlive the bandwagon effect. One of those is the ongoing enthusiasm surrounding Harley Davidson motorcycles.

When it comes to motorcycles, on one end of the spectrum are there are the lightweight import ‘crotch-rocket’ bikes with incredible speed, and on the other end are the loud, heavy, chromed-out Harley Davidson street bikes for the leather-clad, bandana-and-shades wearing crowd. The Harley Owners Group (HOG) is a huge association of Harley enthusiasts, gathering daily all over the country. It’s a growing group, so much so that a few years ago the company changed its ticker symbol to HOG from the former HDI.

For some, the Harley lifestyle is a way of life they embrace 24/7. For others, it’s a separate persona they shift to after work or on the weekends, donning their chaps and black sleeveless shirts as they hit the streets to meet up with their biker brethren to share stories, make noise, and of course show off their rides. It brings people from all walks of life together, with the hobby transcending social status, race, or age. No matter who they are or where they’re from, they all love it, and they’re committed to the brand.

As for the stock itself, the past year has shown some real promise as well, tacking on 22% despite the market weakness which impacted the name early last summer. HOG trended higher from last summer into the early part of this year, before settling into a trading range from late-January to mid-April. It left that range to the downside a few weeks ago, and we’ve seen a series of lower highs created on the daily chart since then as bounce attempts have repeatedly been greeted with supply. As a result, prices have worked lower in search of support.

Over the past week, HOG has successfully tested the early-May low, which is encouraging. Looking closer, that’s the same area the stock contended with in mid-January (a key support level from which the stock rallied $7), as well as last spring (April resistance which marked a multi-month high). This $36 area is clearly a major level.

Given that the multi-week downtrend from the early-April high has become perhaps a bit too predictable, as well as the fact major support has been found, this stock could be looking at an upside reversal in the days ahead.

I like the defined risk this play offers from a technical standpoint, but also due to the psychological implications a turnaround in price could mean. Not only would shorts need to cover as they see this stock strengthen, but longer-term bulls could quickly come to embrace this as a turning point for the name and put more cash to work as higher prices become more likely.

Here are two looks at the HOG chart, along with my strategy for this play:

HOG-05312011

Chart courtesy of TeleChart

Here’s a bit closer look with my entry & exit parameters.

HOG2-05312011

Chart courtesy of TeleChart

As always, feel free to share your own thoughts, trade ideas, and questions down below in the comments section.  And FYI ~ earnings are due out July 18 according to Yahoo Finance.

Trade Like A Bandit!

Jeff

Tagged With: Chart Reviews

Recommended Broker


Links

Terms of Service
Privacy Policy
Disclaimer
Site Map
Contact us

Follow


Premium Services

Stock Pick Service
Trading Courses
Trader Coaching

Copyright © 2026 TheStockBandit, Inc. · All Rights Reserved