The 50-period moving average is one often used by traders. In fact, simply applying a moving average to a chart will in some programs even default to a 50-period, and it’s one you’ll find on the charts depicted in many trading books and magazines.
It’s clearly popular, but is it relevant?
Maybe.
My take on moving averages is that they should only be applied when a trend is present, should only be relied upon as confirmation of what you should already be seeing in price, and that they should be customized to fit the pace of the existing trend. After all, that’s what a moving average is showing you – the pace of the trend.
What I mean by that is that a stock that’s accelerating higher with exceptional momentum should have a different period moving average than the steady-as-she-goes creeper of a stock. Generally speaking, the hotter the pace of the trend, the smaller should be the period of the MA. Likewise, the slower the pace of the trend, the more useful a longer-period moving average will be. Read this paragraph again slowly before you proceed! Too many traders think there’s magic in a moving average, but it’s simply something to reflect the pace of the trend, whether it’s a 50-period, a 13-period or any other number.
So there’s the explanation of it. Let’s get to what matters: some examples.
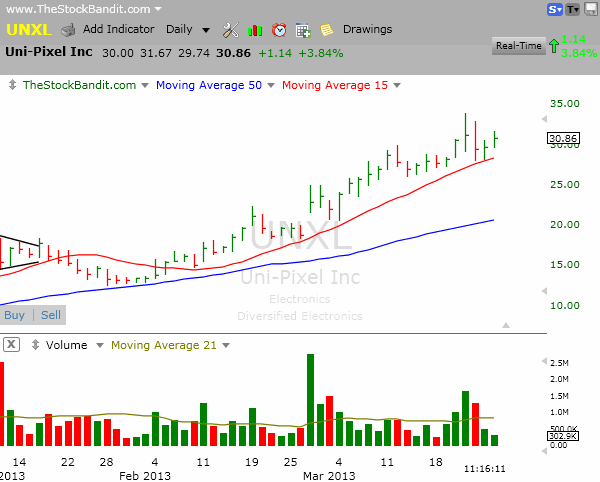
Up first is UNXL, which has been moving higher at a very rapid pace to put it mildly. The 50-day MA (shown in blue) is nowhere close to price, and therefore is completely irrelevant. Perhaps it was useful pack in late January, but keep in mind that as the trend accelerates in pace, the slower moving averages will simply get left behind and no longer matter. In this case, the 15-day MA (shown in red) has been keeping the recent pace of the trend. The stock is trending with great momentum, and a shorter period moving average is far more useful right now.

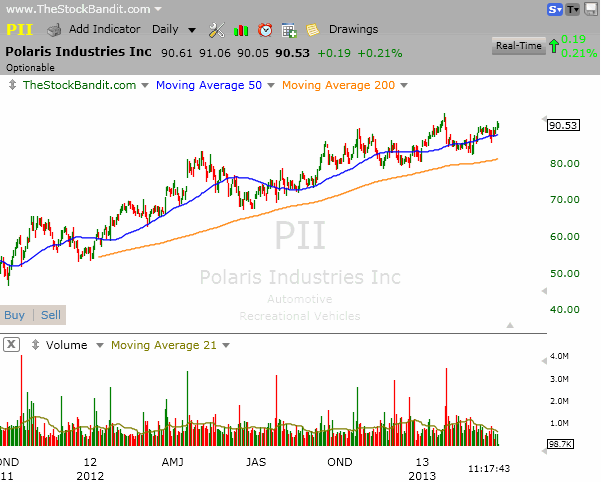
Up next is PII, which has been moving at a really slow pace. This is your grandfather’s uptrend, and the 200-day MA (shown in orange) is more useful here because it more closely tracks the pace of the trend. It’s a period that has been respected multiple times in recent months, whereas the (blue) 50-day has been totally ignored numerous times by price – it’s irrelevant because the pace of this trend is slower.

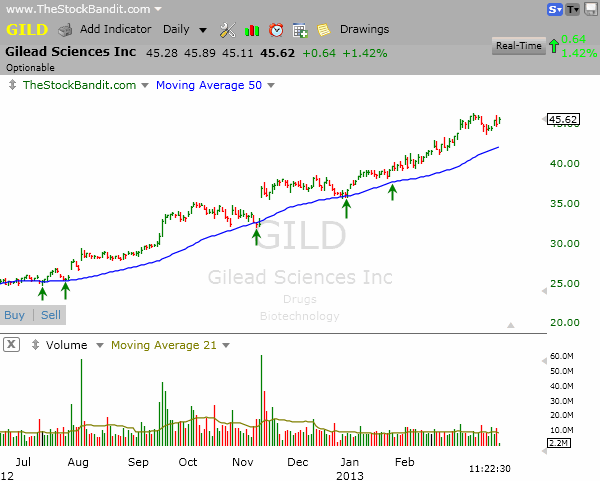
GILD, on the other hand has been respecting the 50-day for some time now. Pullbacks to that area have proven to be good entries on the long side. Although it still guarantees nothing going forward, the 50-day has proven useful for many months in this particular stock.

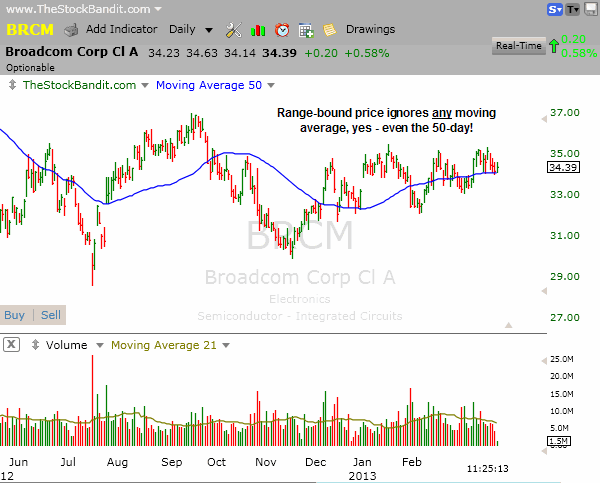
Finally, remember that all stocks will completely ignore ANY moving average when price gets caught in a trading range, so no moving average is relevant when that is the case. Pull them off your charts when that is the case! Here’s a look at BRCM and look at how frequently the 50-day MA was ignored as price zigged and zagged across it in recent months:

Here’s the bottom line: the 50-day MA might or might not be useful. Far too many traders leave it on their chart indefinitely and give it undue credit in too many cases. As price approaches it, they say “well there’s the 50-day so this is a good setup” and they don’t even stop to examine whether the 50-day MA has even been relevant recently. Don’t make that senseless mistake!
Instead of applying it (or any other fixed moving average) to every chart you examine, why not create a custom-made indicator for the trends you’re looking at? Maybe a faster MA will be more useful, or maybe a slower one. Just don’t get tied to one fixed-pace moving average and decide it’s the be-all, end-all solution for your trading, because that simply is not the case. Be more creative than that! Fiddle with the period until you get something useful!
If this is over your head and you need the 101 on technical analysis, don’t worry. That is the kind of thing we teach in our Basic Course, and you need to be in that course if you need more help understanding the charts or the fundamentals of trading.
Trade Like a Bandit!
Jeff White
Take a trial to our Stock Pick Service to get our trades.


