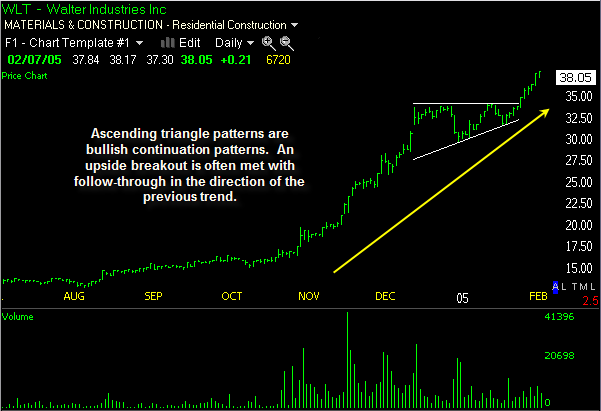
Ascending triangle patterns are bullish and often form within uptrends in stocks as continuation patterns. The ascending triangle pattern resembles a narrowing triangle with a horizontal line of overhead resistance for the stock and an ascending trend line or rising trend line beneath the stock. The overhead resistance temporarily prevents the stock from advancing higher, while the rising trend line beneath the stock signals that buyers are still present. An upside penetration of the upper horizontal trend line is a technical buy signal for a stock breaking out from an ascending triangle pattern.
Context: Found within an uptrend, the ascending triangle forms as a consolidation period within the uptrend and indicates upside continuation will follow.
Appearance: The trend is well-established, and the formation of the ascending triangle is a resting phase for the stock. A trend line can be drawn connecting multiple highs during this time, which should be horizontal to indicate some resistance above current prices. A second trend line is an ascending or rising trend line which connects multiple higher lows during this period, completing the ascending triangle pattern. A breakout should occur about 2/3 of the way into the triangle, and happens when the overhead resistance is penetrated to the upside and buyers rush in to accumulate shares. A stock which does not break out prior to reaching the apex of the triangle is generally sluggish and often a less reliable trading candidate. Volume contracts during the consolidation phase, and should expand during the breakout.
Breakout Expectation: The widest portion of the triangle may be measured and added to the breakout point (resistance level) to determine the expected price advance which follows.

This stock formed an ascending triangle pattern during its uptrend which led to upside continuation. The buy point is when price clears the upper trend line and volume expands to take the stock higher.
Members of our stock pick service see us trading ascending triangle patterns regularly. Come trade with us!
Be sure to learn more about triangle patterns such as the descending triangle pattern and the symmetrical triangle pattern.


