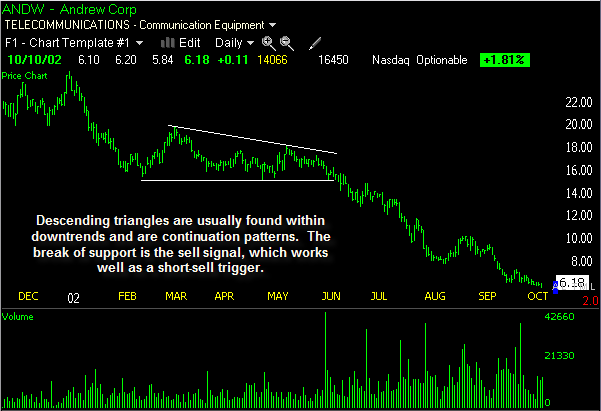
Descending triangle patterns are bearish and often form within downtrends in stocks as continuation patterns. The descending triangle pattern resembles a narrowing triangle with a horizontal line of support beneath the stock and a descending trend line or downtrend line above the stock. The horizontal trend line serves as support which temporarily prevents the stock from declining, while the descending trend line above the stock signals that sellers are still present. A downside penetration of the horizontal trend line is a technical sell signal for a stock breaking down from a descending triangle pattern, and indicates distribution will follow.
Context: Found within a downtrend, the descending triangle forms as a consolidation period within the downtrend and indicates downside continuation will follow.
Appearance: The trend is well-established, and the formation of the descending triangle is a resting phase for the stock. A trend line can be drawn connecting multiple lows during this time, which should be horizontal to indicate some support beneath current prices. A second trend line is a descending or downtrend line which connects multiple lower highs during this period, completing the descending triangle pattern. A breakdown should occur about 2/3 of the way into the triangle, and happens when the support level is broken and sellers rush to unload shares. A stock which does not break down prior to reaching the apex of the triangle is generally sluggish and often a less reliable trading candidate. Volume contracts during the consolidation phase, and should expand during the breakdown.
Breakdown Expectation: The widest portion of the triangle may be measured and subtracted from the breakdown point (support level) to determine the expected price decline which follows.

This stock formed a descending triangle pattern during its downtrend which led to further selling and continuation of the downtrend. The technical sell signal is when price breaks the lower horizontal trend line and volume expands as the selling resumes to push the stock lower.
The descending triangle pattern is a bearish pattern we’ve found reliable, which is why we point these out to members of our stock pick service. Come trade with us!
Be sure to learn more about triangle patterns such as the ascending triangle pattern and the symmetrical triangle pattern.


