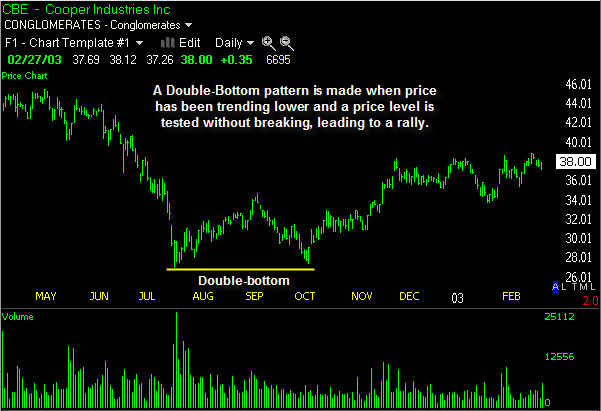
A double bottom is a reversal pattern which occurs following an extended downtrend. This bullish pattern is named for the pair of lows which form when price is unable to achieve a new low. The buy signal is when price breaks above the reaction high which formed between the two lows.
Context: The double bottom must follow an extended price decline or downtrend. The two lows which form do not have to be equal in price, but rather in the same area with a minor reaction high between them. This is a reliable indicator of a potential reversal to the upside.
Appearance: Price trends lower and forms a new low. This is followed by a minor bounce or upside retracement, which forms a reaction high before one final low-volume downward push is made to the area of the recent low. In some cases the prior low is never reached, while in others it is briefly penetrated to the downside, but price does not remain below it. This pattern is considered complete once price makes the second low and then penetrates the highest point between the lows, called the reaction high. The buy indication from this bottoming pattern occurs when price breaks the reaction high to the upside.
Breakout Expectation: A double bottom pattern becomes official when the reaction high is penetrated to the upside, ideally accompanied by expanding volume. From this point, the distance from the reaction high to the low is added to the reaction high to indicate the upside price target. Often times a double bottom will mark a lasting low and lead to a significant price advance which exceeds the price target to the upside.

This stock formed a double bottom after a big price decline. Once price penetrated the reaction high which formed between the lows, it trended higher.
The double bottom pattern is often mistakenly identified within a downtrend, but we point them out to members of our stock pick service when we see conditions which make this pattern more reliable. Come trade with us!
Be sure to learn about the double top pattern.


