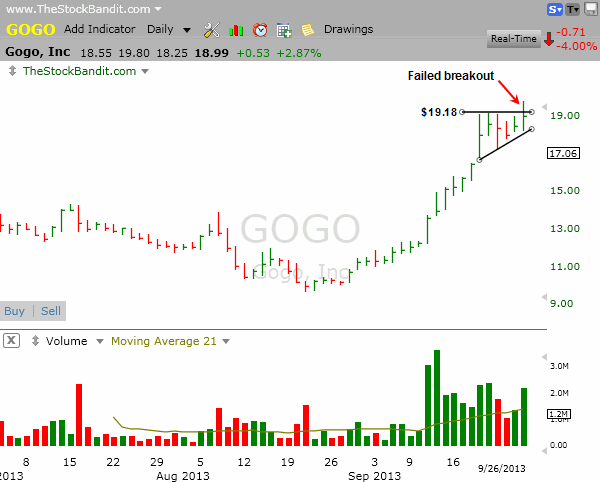
The daily chart of GOGO has been providing some excellent lessons lately. A few weeks ago it displayed what momentum looks like with it’s short-squeeze-like runup off a fresh August low to make a new all-time post-IPO high of $19.18 on Sept. 20. Price began to settle down for a few days to digest the move, which formed an ascending triangle pattern to set up a potential second leg higher.
The breakout attempt from Sept. 26 didn’t hold, however, setting a new high only to close back beneath resistance. That was a failed breakout, which is something no bull ever enjoys seeing. Here’s a look at the chart up until then:
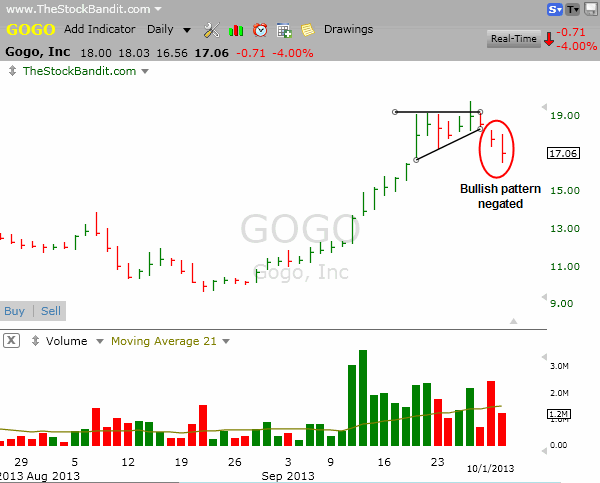
The following day (last Friday, Sept. 27), price tagged the Sept. 20 high to the penny ($19.18) and then finished just 7c off its low on the session. Then this week, price gapped lower on Monday and has continued to decline in a decisive fashion to completely fail the bullish setup. Price is now seeing some long-awaited profit-taking and at this point a new support zone will need to be established before a trade opportunity on the long side surfaces. Here’s how it currently stands:
Identifying momentum can be a good thing, but it brings with it some warnings. Locating it while still running hot can deliver some quick gains, but it’s imperative to recognize that it won’t last forever. High-level bases can certainly produce continuation, but a failure to hold a breakout attempt is always a warning flag worth noting. And anytime price completely negates a setup, a reversal is underway and should not be ignored.
If you need help understanding chart patterns and the fundamentals of trading, you’re in luck. This is the type of information we teach you in our stock trading courses.
Trade Like a Bandit!
Jeff White
Take a trial to our Stock Pick Service to get our trades.


