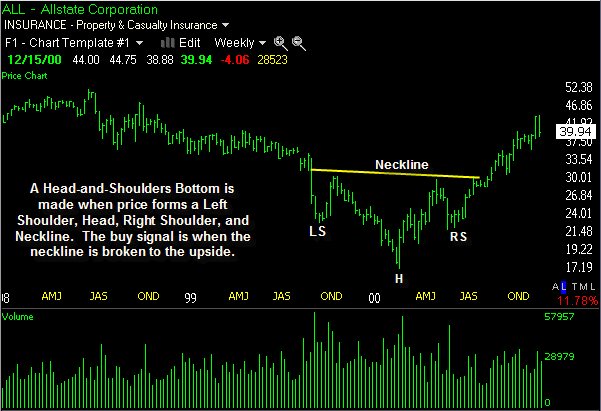
A head and shoulders bottom is a reversal pattern which occurs following an extended downtrend. This bullish pattern is named for the three lows which resemble an inverted head and shoulders pattern. The buy signal is when price breaks above the neckline.
Context: The head and shoulders bottom occurs after a lengthy downtrend and is a bottoming formation. Volume in the formation of the left shoulder is often higher than volume during the formation of the head, confirming that price is declining with less intensity, and perhaps soon will find support. As the right shoulder completes, volume often will increase with the resulting price advance back up toward the neckline.
Appearance: The head and shoulders bottom or inverted head and shoulders must follow an extended price decline or downtrend. Price makes a low which forms the left shoulder and bounces to a minor high. Price then achieves a major low which forms the head, then bounces to form one more minor high. Price declines again but does not penetrate the major low before it bounces, forming the right shoulder. The minor highs are connected with a trend line which may slope upward, and this trend line is called the neckline. An upside breakout from the neckline is the buy signal for this pattern, which confirms that a lasting low has been made and that a reversal of the downtrend has been made.
Breakout Expectation: A head and shoulders bottom is confirmed with the upside penetration of the neckline. To determine an upside price objective from the confirmation level, add the distance from the low of the head to the neckline. This is called a measured move. Because these patterns are known to mark important and lasting lows, the upside move which follows may exceed the distance from the head to the neckline and be met with additional buying and momentum.

This stock formed a head and shoulders bottom after a big price decline. Once price penetrated the neckline which formed along the reaction highs, the stock reversed the downtrend and moved higher.
Be sure to learn about the head and shoulders top.


