The averages were sending mixed signals as recently as last Wednesday, but by Friday they were all singing the same tune: selloff. The NAZ and RUT were making new multi-year and all-time highs, but the blue chip S&P 500 and DJIA each were hesitant to challenge resistance. The senior indexes dragged the others along for a turbulent ride for Thursday and Friday, leaving each of them with rapidly deteriorating technical conditions.
As we head into a new week of trading, it’s time once again to take a look at the indexes and the key levels they’re dealing with. This will impact how individual names move, so it’s where every new trading week begins.
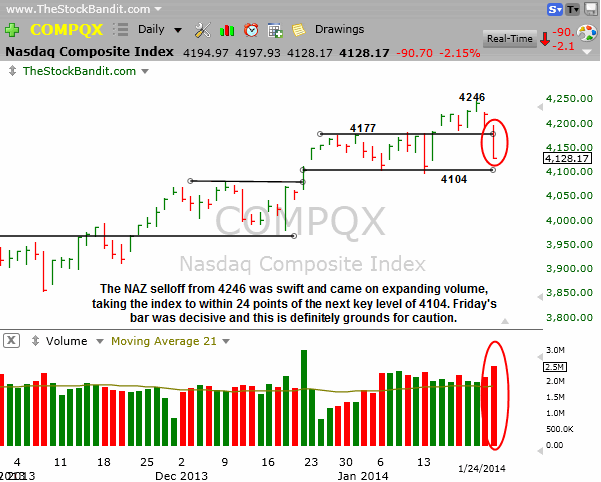
NAZ – The NAZ took a dive right off its fresh multi-year high from Wednesday of 4246 to finish 118 points lower by Friday’s close. In the process, it gave up 4177 and now stands just 24 points from next key multi-week support of 4104.
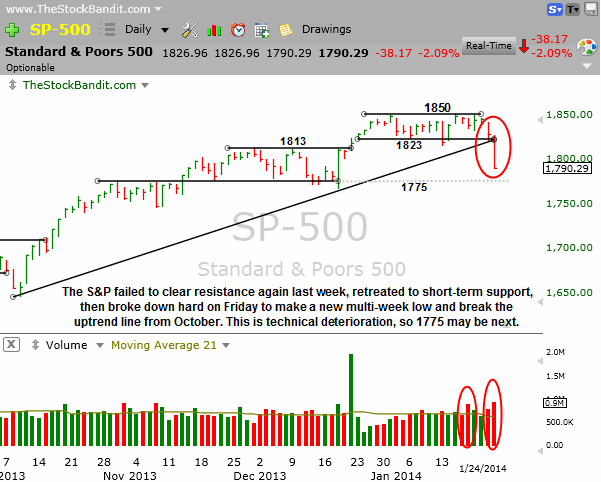
SP500 – The S&P never could clear resistance despite numerous opportunities, including last week. It turned south on Thursday then hit the dirt on Friday to finish 60 points below 1850. This hard breakdown from the multi-week trading range (1823) was accentuated by the decisive break of rising support going back to last October. This index is not in good shape with price action like this, so the bulls are on their heels.
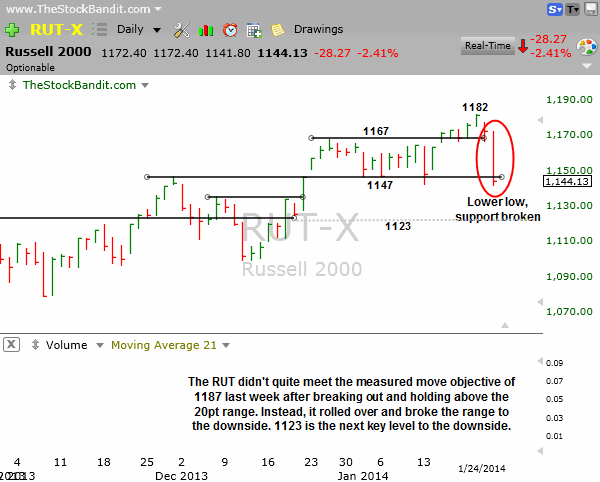
RUT – The RUT was just 5 points from a measured move target of 1187 as of Wednesday, but a hard selloff on Thursday and Friday left it not only below the 1167 breakout but also below the low end of the range at 1147. This is a huge failure for the small-caps, and now a former high at 1123 is the next level to watch on the way down.
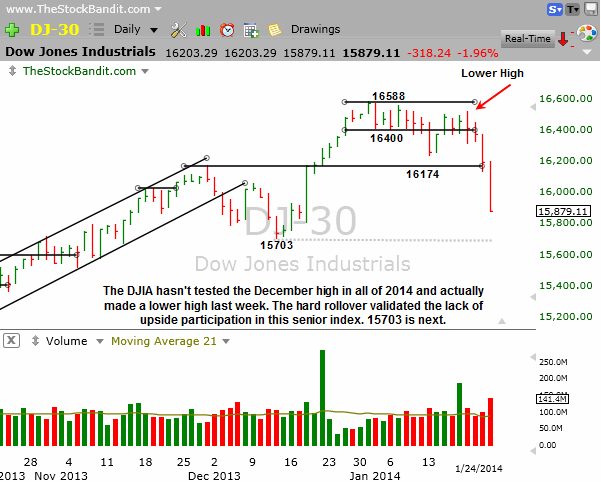
DJIA – The DJIA shed 318 on Friday alone, but was down all 4 sessions last week. This index has been the clear laggard, and the failure to hold 16400 was quickly followed by a break below the former high of 16174. Now we need to watch 15703, the December low, as next potential support.
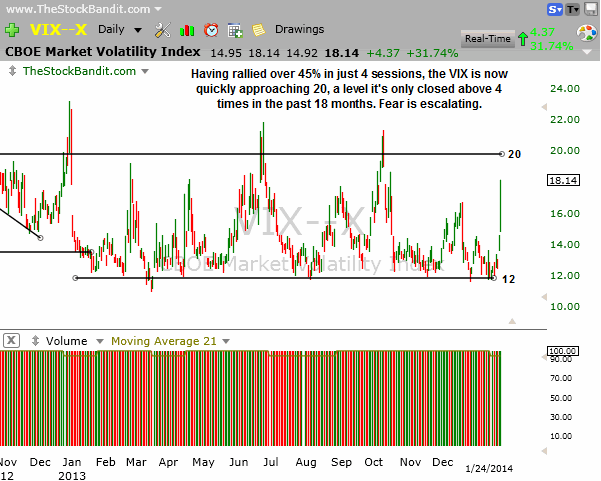
VIX – Complacency is so two weeks ago. Last week it took a hike. The VIX spiked big as a result, jumping over 45% in the 4-day trading week to clear 18. This ‘fear index’ is fresh off a test of long-term support at 12, but hasn’t cleared the first real threshold yet. That is 20, which we’ve only seen 4 closes above in the past 18 months. This index belongs on the radar for now as we watch to see if it continues to spike along with broad market weakness.
Take a trial of the Stock Pick Service to get my trades.
Trade Like a Bandit!
Jeff White


